pak::pak(c("tidyverse", "tidylog", "janitor", "here", "readxl"))10 Import and Join Data
Class Objectives
- Where to put data files in your R Project
- How to import data from files
- How to join relational data
Packages for this chapter
We’ll be using tidyverse (which includes readr), plus handy packages: tidylog (for feedback on the tidyverse pipeline), janitor (for cleaning messy names), here (for project-relative file paths), and readxl (for reading Excel files).
If you haven’t installed them, run this code:
So far, we’ve only worked with data bundled inside packages. In real-world scenarios, however, data is often stored in external files—like Excel or CSV—and may be spread across multiple files. To get it all into one tidy tibble, we typically import the data first, then merge the datasets using the appropriate joining functions. Let’s begin by loading the packages we’ve been using all along:
library(tidyverse)
library(tidylog)
10.1 Where your data files go
Keep every data file in the data/ folder of your course project (set up in Chapter 7), and open the project through eeb_c234.Rproj before you start. Then a relative path like "data/per-capita-co-emissions.csv", or here::here("data", "per-capita-co-emissions.csv") (see Chapter 7), works on any computer.
For this chapter, download the data files below into your project’s data/ folder.
10.2 Import data
One way to import data in RStudio is to click Import Dataset in the Environment pane, navigate to your file, and let RStudio generate the code for you. The generated code is just a call to a function such as read_csv(), which you can also write yourself. read_csv() (from readr, part of the tidyverse) is preferable to base R’s read.csv() because it is faster, keeps text as text, and does not change column names. Here’s an example where we import a CSV containing per-capita CO₂ data, taken from Our World in Data:
📥 Download per-capita-co-emissions.csv
read_csv("data/per-capita-co-emissions.csv")Importing an Excel file works the same way with read_excel() from the readxl package. It can also pick a sheet or a cell range:
library(readxl)
read_excel(here::here("data", "data_beninca.xlsx"), sheet = 1)
For cleaner column names, the janitor package offers a handy function called clean_names(). It converts column headers into lower-case words separated by underscores (among other things). Let’s see it in action:
# if you don't have the janitor package installed, you can install it with the following command
# pak::pak("janitor")

read_csv("data/per-capita-co-emissions.csv")  |>
    janitor::clean_names()
This often saves you time and frustration, especially when working with large or messy real-world datasets. It has been a time-saver for me on many occasions.
Additionally, we should rename() the columns to make them more readable. Note that the file also has an entity column (here, always “World”); we won’t need it.
data_co2 <- read_csv("data/per-capita-co-emissions.csv") |>
janitor::clean_names() |>
rename(
co2 = annual_co2_emissions_per_capita
)- 1
-
We use the
clean_names()function to make column names more readable. - 2
-
We use the
rename()function to rename the column. - 3
-
We rename the column
annual_co2_emissions_per_capitatoco2.
As always, let’s do a quick plot to sense-check our data:
data_co2 |>
ggplot(aes(x = year, y = co2)) +
geom_line() +
labs(
x = "Year",
y = "Annual CO2 emissions per capita"
) +
theme_minimal()- 1
- We use a line plot to show the evolution of CO2 emissions over time.
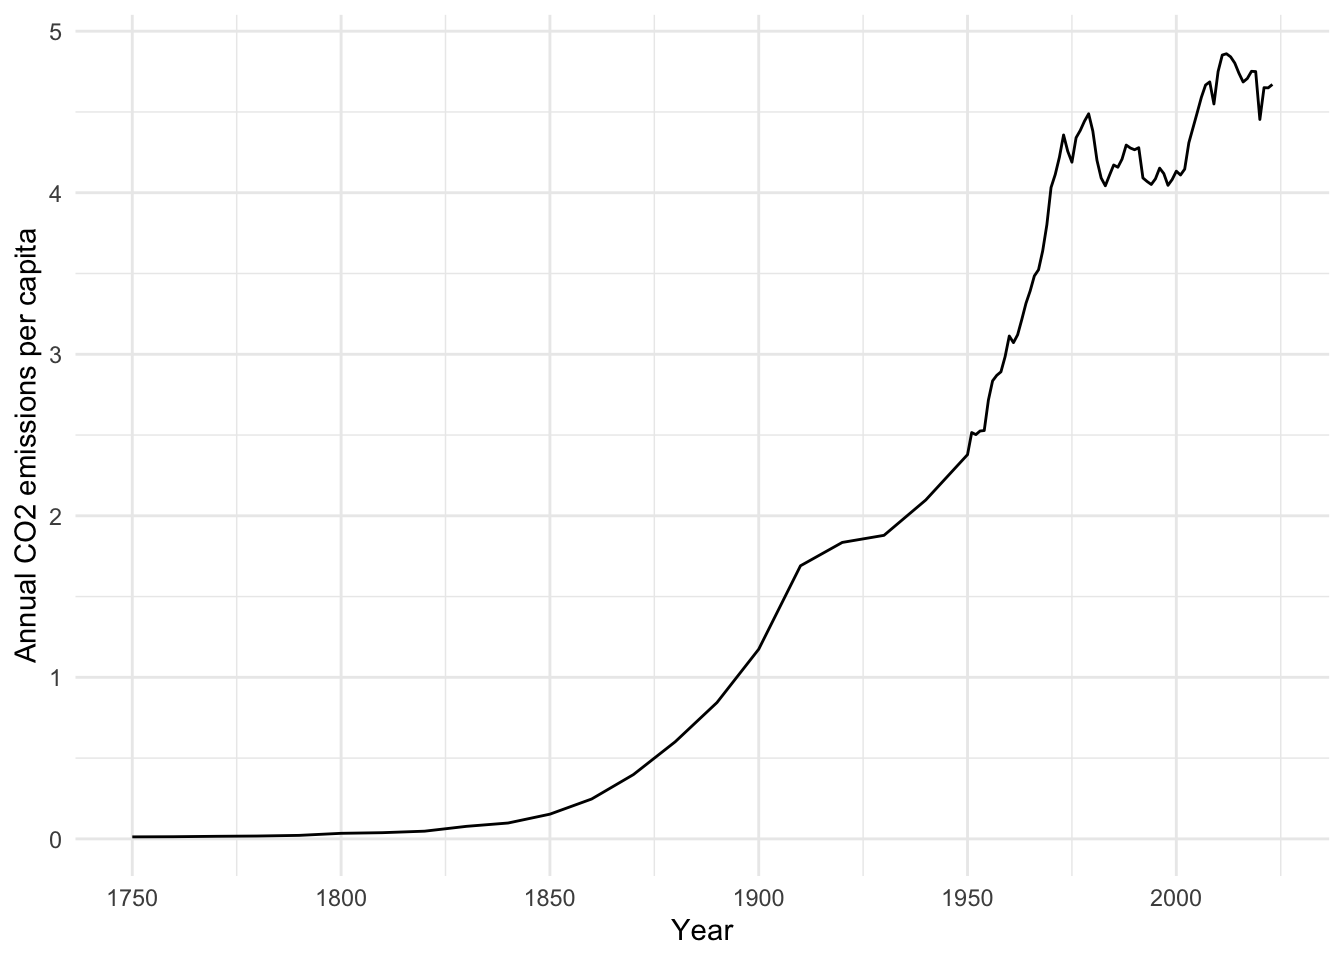
We see emissions rising across the years, but the real question might be how CO₂ levels relate to global temperature. For that, we’ll need to import temperature data and then join both datasets together.
10.3 Join Relational Data
We can fetch temperature data—also from Our World in Data—and load it similarly:
📥 Download temperature-anomaly.csv
data_temp <- read_csv("data/temperature-anomaly.csv") |>
    janitor::clean_names()  |>
    select(year, global_average_temperature_anomaly_relative_to_1961_1990) |>
    rename(temp_anomaly = global_average_temperature_anomaly_relative_to_1961_1990)

data_temp
We keep only year and the temperature anomaly. (The original file has other columns, including confidence bounds and a code column that is empty for this series.) Note that the temperature series starts in 1850, whereas the CO₂ series starts in 1750.
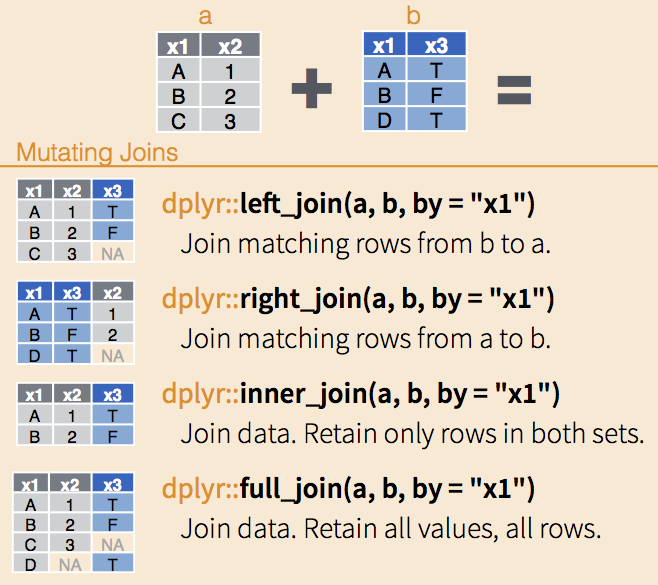
Now we have two data frames: data_co2 and data_temp. Both contain a year column, which we can use as the “key” for joining. The left_join() function retains all rows of the left data frame (data_co2 in this case) and matches where possible. Rows of data_co2 that have no matching year in data_temp (everything before 1850) get NA for temp_anomaly:
data_co2  |>
    left_join(
        data_temp,
        by = "year"
    )
Notice that joins are asymmetric. Switching the order to left_join(data_temp, data_co2, by = "year") wouldn’t produce the same result. A left join always keeps every row from the left-hand dataset, filling missing matches from the right dataset with NA. (Watch out: if a key value appears more than once in the right-hand dataset, the left join will produce more rows than the left dataset had, so always check the number of rows. tidylog helps here.) I highly recommend to stick to left_join() for consistency (and also forces you to think about which dataset is your primary source of information). However, you can also use right_join(), inner_join(), or full_join() depending on your needs.
With our combined data, we can see how temperature anomaly compares to per-capita CO₂ emissions. We use drop_na() to remove the pre-1850 years that have no temperature data, since they cannot be plotted anyway:
data_co2  |>
    left_join(
        data_temp,
        by = "year"
    )  |>
    drop_na() |>
    ggplot(
        aes(x = co2,
            y = temp_anomaly)
        ) +
    geom_smooth(se = FALSE) +
    geom_point(aes(color = year)) +
    scale_color_viridis_c() +
    labs(
        x = "Annual CO2 emissions per capita",
        y = "Average temperature anomaly"
    ) +
    theme_minimal()
left_join: added one column (temp_anomaly)
> rows only in data_co2 10
> rows only in data_temp (91)
> matched rows 84
> ====
> rows total 94
drop_na: removed 10 rows (11%), 84 rows remaining
`geom_smooth()` using method = 'loess' and formula = 'y ~ x'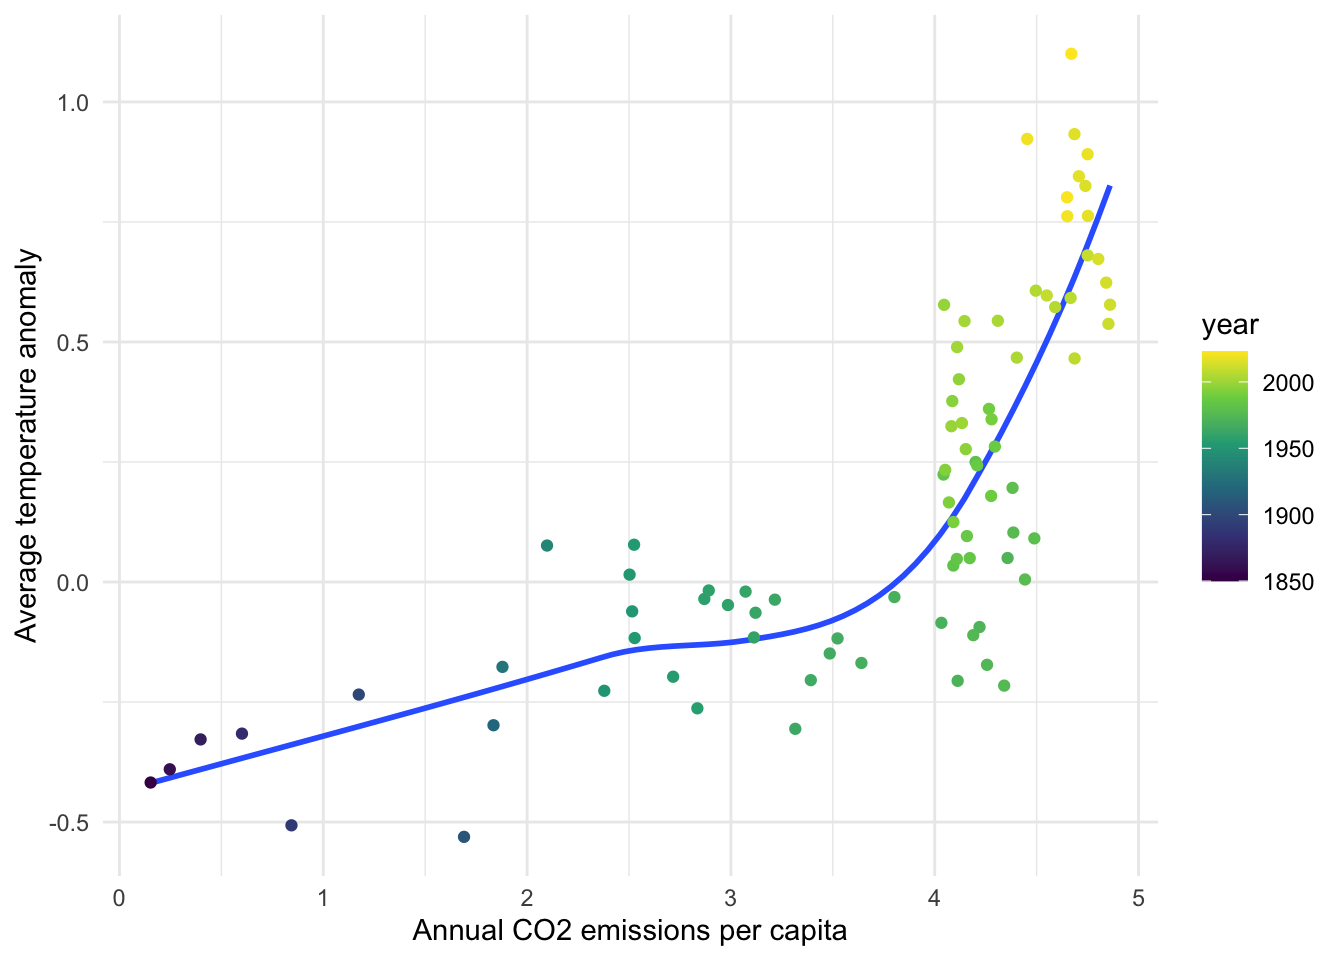
Both series trend upward over time, so this plot shows that they move together, not that one causes the other.
Exercise
We will use the band_members and band_instruments datasets (both come with dplyr) to practice joining data. First print both datasets and note which name values appear in each. Then do the following:
- Use
left_join()withband_membersas the left table. - Flip the order so that
band_instrumentsis the left table. - Use
inner_join()andfull_join()to joinband_membersandband_instruments. Which names appear in each result, and where do you seeNA?
library(tidyverse)

band_membersband_instrumentsband_members |>
left_join(
band_instruments,
by = "name"
)left_join: added one column (plays)
> rows only in band_members 1
> rows only in band_instruments (1)
> matched rows 2
> ===
> rows total 3band_instruments |>
left_join(
band_members,
by = "name"
)left_join: added one column (band)
> rows only in band_instruments 1
> rows only in band_members (1)
> matched rows 2
> ===
> rows total 3band_members |>
inner_join(band_instruments, by = "name")inner_join: added one column (plays)
> rows only in band_members (1)
> rows only in band_instruments (1)
> matched rows 2
> ===
> rows total 2band_members |>
full_join(band_instruments, by = "name")full_join: added one column (plays)
> rows only in band_members 1
> rows only in band_instruments 1
> matched rows 2
> ===
> rows total 4Notice that when we flip the order of the data frames in left_join(), the results change, because a left join always “favors” the data frame that comes first: Mick is kept when band_members is on the left, and Keith is kept when band_instruments is on the left, each with NA for the missing information. inner_join() keeps only names found in both tables (John and Paul), while full_join() keeps every name from both tables (Mick, John, Paul, Keith) and fills in NA where there is no match.