pak::pak(c("tidyverse", "palmerpenguins", "tidylog", "datasauRus", "jtools", "ggrepel", "dcl-docs/dcldata"))9 Five verbs for tidying data
Class Objectives: Mastering common
tidyr verbs
- Reshape data
pivot_longer(): Transform wide data into a longer, “tall” format.
pivot_wider(): Transform long data into a wider format.
- Split cells
separate(): Split one column into multiple columns.
- Dealing with missing values
drop_na(): Drop rows with missing values.replace_na(): Replace missing values with a specified value.
Packages for this chapter
If you haven’t installed the following packages, run this code:
It’s often said that data cleaning and preparation consume the lion’s share of an analyst’s time—frequently claimed to be a large majority (figures as high as 80% are often quoted, though they are rough estimates). When real-world data arrives on your desk, chances are it isn’t in a convenient format. Columns may be mislabeled or scattered, variable names might be confusing, and rows may contain missing information. Over the years, analysts have discovered that a consistent “tidy” format for data is invaluable: it lets you focus on extracting insights rather than wrangling columns and rows into submission.
Tidy datasets are all alike, but every messy dataset is messy in its own way. — Hadley Wickham, “Tidy Data” (Journal of Statistical Software, 2014)
In practical terms—and echoing our earlier discussion—a tidy dataset has these defining traits:
- Every row represents one observation.
- Every column represents one variable.
- Every cell contains a single value.
The tidyr package (part of the tidyverse) is designed to help transform messy data into this tidy structure. In this chapter, we’ll explore some of the most commonly used tidyr functions, using example datasets that demonstrate where each function shines. We’ll pause our use of the penguins dataset momentarily, because it’s already tidy; instead, we’ll rely on some datasets from dcldata to illustrate typical data-wrangling challenges.
library(tidyverse)
library(tidylog)
library(palmerpenguins)

# dcldata is on GitHub, not CRAN. If you haven't installed it, run:
# pak::pak("dcl-docs/dcldata")
library(dcldata)
Evolution of Tidying Data in R
Hadley Wickham developed the reshape package (2005) and its successor reshape2 (2010) to handle this task. Later, the tidyr package introduced gather() and spread() (2014) as an improved approach. These have since been superseded by pivot_longer() and pivot_wider(), which offer greater clarity and consistency. The older functions still work (they are retired, not removed), but it is recommended to use the newer ones in new code.
9.1 pivot_longer()
Let’s begin with the example_eagle_nests dataset from U.S. Fish and Wildlife Service:
example_eagle_nestsNotice that 2007 and 2009 are stored as column names, but they’re really values (i.e., years). This is a classic “wide” format. We can use pivot_longer() to convert it into a tidy format:
eagle_nests_longer <- example_eagle_nests |>
pivot_longer(
cols = c(`2007`, `2009`),
names_to = "year",
values_to = "nests",
names_transform = list(year = as.integer)
)
eagle_nests_longer- 1
-
pivot_longer()transforms wide data into a longer, “tall” format. - 2
-
colsspecifies the columns to pivot. - 3
-
names_tocreates a new column holding the former column names. - 4
-
values_tocreates a new column holding the values previously spread across multiple columns. - 5
-
Column names are always text, so
yearwould otherwise be a character column.names_transformconverts it to integer so that you can do arithmetic or plot it on a numeric axis.
Why are “year” and “nests” in quotes? Because they are new column names that we are creating, and names_to and values_to take strings.
Specifying the columns can sometimes feel like using select(). For instance, you can list the columns to include, or exclude the columns you want to keep untouched. The code below achieves the same result by excluding everything but region:
example_eagle_nests |>
    pivot_longer(
        cols = -c(region),
        names_to = "year",
        values_to = "nests"
    )
Exercise
Try your hand on the billboard dataset (in tidyr). This dataset has columns labeled by week (wk1 through wk76), but we want a tidy format that moves those week columns into a single “week” variable and the rankings into another “rank” variable. Use pivot_longer() to make it happen.
9.2 pivot_wider()
The pivot_wider() function reverses what pivot_longer() does, turning long datasets into wide formats. Suppose you want to revert our eagle_nests_longer data back to its original shape:
eagle_nests_longer |>
pivot_wider(
names_from = "year",
values_from = "nests"
)- 1
-
pivot_wider()transforms long data into a wider format. - 2
-
names_fromidentifies which column contains the new column names. - 3
-
values_fromidentifies the column whose values will fill the new cells.
Let’s see a more practical example with our penguins dataset. Perhaps we want to compare bill length between male and female penguins for each species. We can create a summary of the mean bill length by species and sex, then convert that summary into a wide layout:
We firstly use our hard-earned data transformation skills to calculate the mean bill length by the groups
penguins |>
drop_na(sex) |>
group_by(species, sex) |>
summarize(mean_bill_length = mean(bill_length_mm, na.rm = TRUE))- 1
-
Some penguins have no recorded
sex; we drop them so that we only compare male and female. - 2
-
A few penguins are missing
bill_length_mm, so we usena.rm = TRUE.
Because comparing values side by side can be clearer, let’s pivot the data wider:
penguins |>
   drop_na(sex) |>
   group_by(species, sex) |>
   summarize(mean_bill_length = mean(bill_length_mm, na.rm = TRUE)) |>
   ungroup() |>
   pivot_wider(
      names_from = "sex",
      values_from = "mean_bill_length"
   )
We can go one step further and visualize how male and female bill lengths compare. Each point is a species; the line marks equal male and female values, so a point above the line would mean larger females, and a point below it means larger males:
penguins |>
   drop_na(sex) |>
   group_by(species, sex) |>
   summarize(mean_bill_length = mean(bill_length_mm, na.rm = TRUE)) |>
   ungroup() |>
   pivot_wider(
      names_from = "sex",
      values_from = "mean_bill_length"
   ) |>
   ggplot(aes(male, female)) +
   geom_point(size = 4) +
   ggrepel::geom_text_repel(aes(label = species), box.padding = 1) +
   geom_abline(intercept = 0, slope = 1) +
   jtools::theme_nice()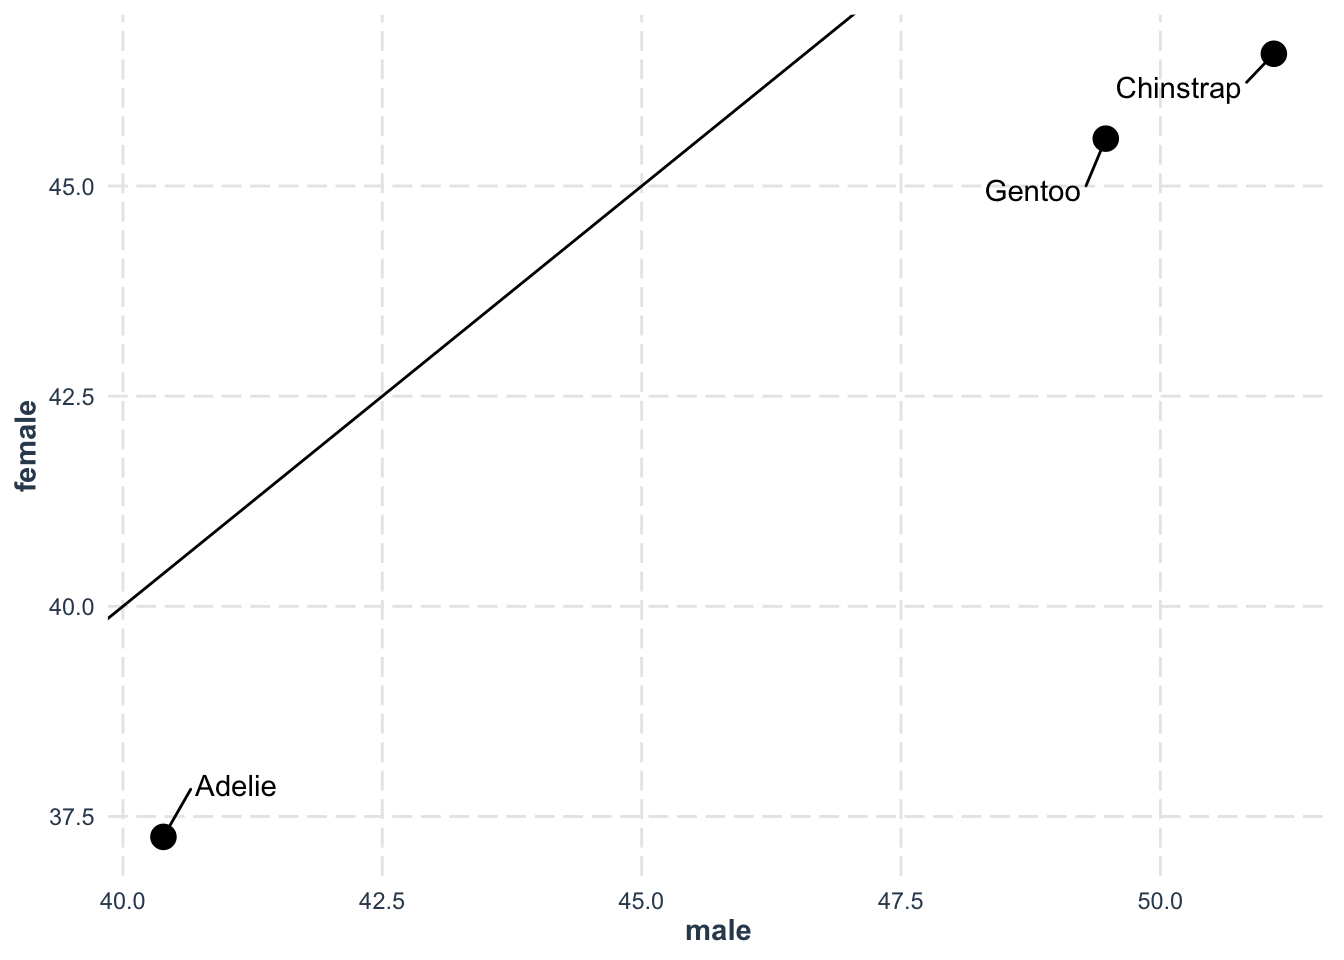
Exercise
The dataset us_rent_income (from tidyr) contains 2017 American Community Survey data, where variable indicates whether it’s yearly income or monthly rent, and estimate gives the numeric value. Use pivot_wider() to reshape, then calculate the ratio of annual rent to annual income (the rent estimate is monthly, so you need to multiply it by 12), and finally sort the results by that ratio.
9.3 separate()
The separate() function allows you to split one column into multiple columns. Consider the example_gymnastics_2 dataset from dcldata, which tracks women’s Olympic gymnastic scores for 2012 and 2016:
example_gymnastics_2The column names aren’t tidy. First, let’s pivot everything into a long format:
example_gymnastics_2 |>
    pivot_longer(
        cols = -c(`country`),
        names_to = "eventandyear",
        values_to = "score"
    )
We see that the new eventandyear column contains both an event name and a year (like vault_2012). We can split this into two columns—event and year—using separate():
example_gymnastics_2 |>
pivot_longer(
cols = -c(`country`),
names_to = "eventandyear",
values_to = "score"
) |>
separate(
col = "eventandyear",
into = c("event", "year"),
sep = "_",
convert = TRUE
)- 1
-
After splitting,
yearwould still be text.convert = TRUEconverts columns to numbers when possible (eventstays text).
Note
In tidyr 1.3.0 and later, separate() is superseded by separate_wider_delim() and related functions (separate_wider_position(), separate_wider_regex()). separate() still works and is widely used, so we teach it here.
unite()
While separate() splits columns, unite() does the opposite: it combines multiple columns into one.
For a simple example, imagine that we’ve separated out the month, day, and year of a date into three columns (month, day, year), but now we want a single date column again. Let’s illustrate with a small toy dataset:
toy_dates <- tibble(
  month = c(1, 2, 3),
  day   = c(15, 20, 25),
  year  = c(2020, 2020, 2020)
)
We can re-combine these columns into one:
toy_dates |>
unite(
col = "full_date",
month, day, year,
sep = "-"
)- 1
- unite() creates a new column (col = “full_date”) from the listed columns (month, day, year).
- 2
- The new column is named “full_date”.
- 3
- The columns to combine are month, day, and year.
- 4
- sep = “-” indicates how to join the columns (here, with a dash).
Exercise
Now let’s tidy the who2 dataset (from tidyr). Columns like sp_m_014 combine multiple pieces of information—diagnosis method (sp), gender (m), and age group (014). Your task:
- Convert the data into a long format using
pivot_longer(). Most cells in the wide table areNAbecause that combination was not recorded, so also drop them by settingvalues_drop_na = TRUE. - Split the combined column into three separate columns (diagnosis, gender, age) using
separate().
9.4 drop_na() and replace_na()
When dealing with real-world data, missing values (often represented by NA in R) are unavoidable. It is a very broad topic and usually question-specific. However, we show two functions that help you manage missing data (for a cautionary example of what can go wrong when missing data are handled carelessly, see this Nature paper). The main point is that you should ALWAYS be explicit about how you handle missing data.
9.4.1 drop_na()
The function drop_na() removes rows that contain any missing values in the specified columns. This can be handy when a row is so incomplete that it’s unusable for analysis.
For example, let’s look at the penguins dataset (pretend we didn’t want to keep partial observations):
penguinsWe can drop any row with missing data simply by doing:
penguins |>
drop_na()- 1
-
drop_na()removes rows with missing values.
drop_na: removed 11 rows (3%), 333 rows remainingIf you only care about missing values in particular columns (say, bill_length_mm), you can specify them as arguments:
penguins |>
drop_na(bill_length_mm)- 1
-
drop_na()removes rows with missing values in thebill_length_mmcolumn.
drop_na: removed 2 rows (1%), 342 rows remaining9.4.2 replace_na()
Sometimes you don’t want to drop missing values—you might prefer to fill them with a default value or placeholder. The replace_na() function allows you to do exactly that.
For instance, we can label the missing values in sex explicitly as “unknown” rather than guessing. Since sex is a factor, we first convert it to character. We then count the values to see the effect:
penguins |>
mutate(sex = as.character(sex)) |>
replace_na(
list(sex = "unknown")
) |>
count(sex)- 1
-
replace_na()needs a replacement that matches the column type, so we convert the factor to character first. - 2
-
Replaces missing values in the
sexcolumn with the value we specify. - 3
-
Count the rows for each value of
sexto check the result.
mutate: converted 'sex' from factor to character (0 new NA)
replace_na: changed 11 values (3%) of 'sex' (11 fewer NAs)
count: now 3 rows and 2 columns, ungrouped
Be careful: filling in a made-up value (such as assuming every missing sex is male) is imputation by guesswork and can bias your analysis.
9.5 Tidy a real dataset
Let’s explore the famous Datasaurus dataset, which perfectly illustrates why visualizing your data is crucial (more info). This dataset contains multiple distributions that have identical summary statistics but look completely different when plotted.
library(tidyverse)
# pak::pak("datasauRus")
library(datasauRus)
datasaurus_dozen_wide- 1
-
datasaurus_dozen_wideis the wide format of the Datasaurus dataset.
Each column name combines a dataset name and a coordinate (x or y), such as dino_x or v_lines_y. To tidy it, we want one row per point, with columns dataset, x and y. A single call to pivot_longer() can do this:
datasaurus <- datasaurus_dozen_wide |>
pivot_longer(
cols = everything(),
names_to = c("dataset", ".value"),
names_pattern = "(.*)_(x|y)"
)- 1
- Pivot every column.
- 2
-
Split each column name into two parts. The first part becomes the
datasetcolumn. The special".value"tellspivot_longer()that the second part (xory) should be used as the names of new value columns, soxandystay as two separate columns. - 3
-
names_patternis a regular expression with one group in parentheses for each part.(.*)_(x|y)means “anything, then an underscore, thenxory”. Because.*is greedy, dataset names that contain underscores (likev_lines) are handled correctly.
pivot_longer: reorganized (away_x, away_y, bullseye_x, bullseye_y, circle_x, …)
into (dataset, x, y) [was 142x26, now 1846x3]datasaurusNow we can demonstrate why this dataset is famous. First, let’s check the summary statistics:
# Calculate summary statistics for each dataset
datasaurus |>
  group_by(dataset) |>
  summarize(
    mean_x = mean(x),
    mean_y = mean(y),
    sd_x = sd(x),
    sd_y = sd(y),
    cor = cor(x, y)
  )
group_by: one grouping variable (dataset)
summarize: now 13 rows and 6 columns, ungroupedDespite having nearly identical summary statistics, when we visualize the data, we see that each dataset forms a completely different shape:
# Create faceted scatter plots
datasaurus |>
  ggplot(aes(x, y, color = dataset)) +
  geom_point() +
  facet_wrap(vars(dataset)) +
  jtools::theme_nice() +
  theme(legend.position = "none") +
  labs(title = "Same summary statistics, very different distributions")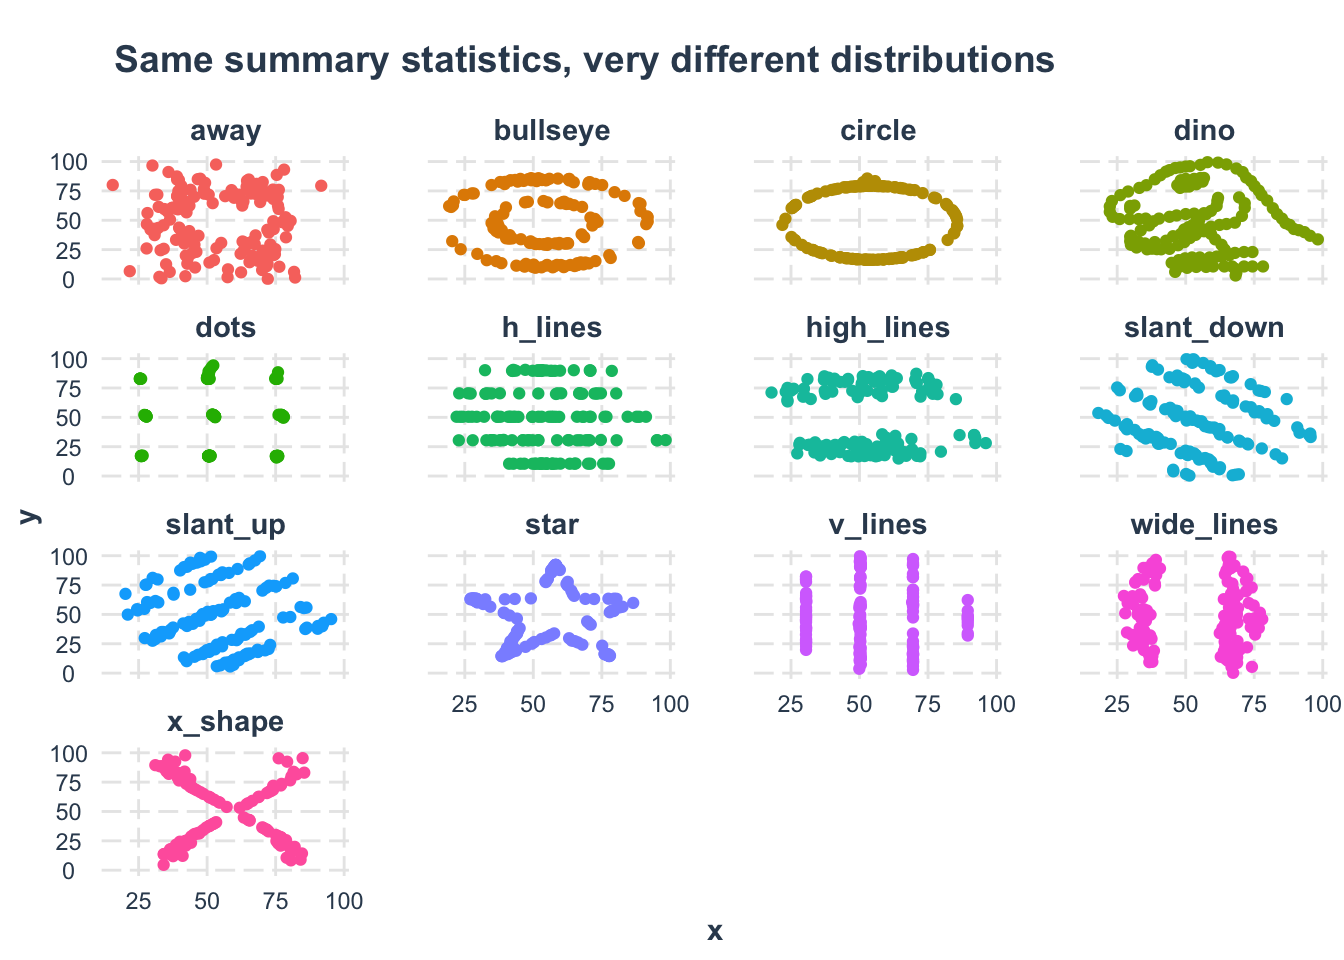
This example demonstrates why it’s essential to both analyze AND visualize your data!