eat(dressed(shower(brush(wakeup(you)))))1 Course goal
1.1 Why Bother with This Course in the Age of AI?
Alright, let’s cut to the chase. You signed up to study Ecology and Evolutionary Biology, not Computer Science. You probably envision yourself out in the field, knee-deep in mud, observing the subtle interactions of ecosystems—not stuck behind a screen, wrestling with semicolons and syntax errors. And now, with these fancy new AI tools that seem to do everything but your taxes, you might be wondering: why bother learning this computational stuff at all? Can’t a chatbot handle it all—generate analyses, whip up some plots, and call it a day?
It’s a fair question. Technology is reshaping everything, and science is no exception. But here’s the thing: just as biologists in the past had to master the microscope, today’s biologists need a strong foundation in computing. This course isn’t about turning you into a programmer; it’s about giving you the keys to harness technology effectively—so you’re steering the ship, not just along for the ride.
Before any anxiety sets in, let me assure you that this course is not gonna be a sink-or-swim experience. We’ll embark on a guided journey into computing, building your skills step by step. Think of it as learning a new language—with much simpler grammar, thankfully. We’ll use concrete example with annotated codes and hands-on exercises to support you along the way.
And about those AI tools? Yes, they can be incredibly useful, no doubt. But relying on them blindly, without understanding the underlying principles, is like cooking from a recipe in a language you barely know. Sure, you might finish the dish, but there’s a good chance you’ll miss something critical—maybe misinterpret a step, add the wrong ingredient, or be puzzled by the end result. Computational literacy helps you to catch when the AI is leading you astray, saving you from headaches (and potentially flawed results) down the line.
I get the temptation of the “easy button”, we all do. But investing in these skills now will pay off many times over. You’ll be a more efficient, more confident researcher—and, frankly, it will boost your chances of publishing in those coveted high-profile journals.
1.2 What You’ll Learn
We’ll cover the following topics, which are, in my view, the most essential computing skills for ecologists today. These are the things I wish I knew when I started grad school – it would have saved me so much time and frustration!
1.2.1 Fluency with R
What is our weapon of choice in this course? The R programming language. It is not the most well-polished language. It is not the fastest language. It is not the most user-friendly language. So, why R? Well, it is the lingua franca in our community. The computational tools in ecology are largely R-based. So, if you want to tap into this wealth, you’ll need a working knowledge of R.
Feeling Adventurous?
Not sold on R? You could try Julia, a newer language that’s faster, more elegant, and gaining popularity. The syntax is similar enough to R to make it a relatively easy transition, and it can even load R packages, so you can have the best of both worlds.
R has also evolved dramatically in the past decade with the rise of the tidyverse suite. When I started grad school, I absolutely hated using R. But the tidyverse transformed that experience. It introduced a coherent way of handling and visualizing data—one that feels logical and intuitive. I firmly believe it’s the right approach to data manipulation and plotting.
Heroes Behind the Tidyverse
The tidyverse revolution is largely thanks to Hadley Wickham, whose contributions earned him the COPSS Presidents’ Award, the top honor in statistics.
But it’s not a one-person show—the tidyverse thrives because of a vibrant community united by a shared vision (link).
1.2.2 Crafting Publication-Ready Figures
With ggplot2, you’ll learn the Grammar of Graphics, one of the most powerful plotting systems out there. Beyond just producing high-quality figures, it will teach you a structured approach to data visualization.
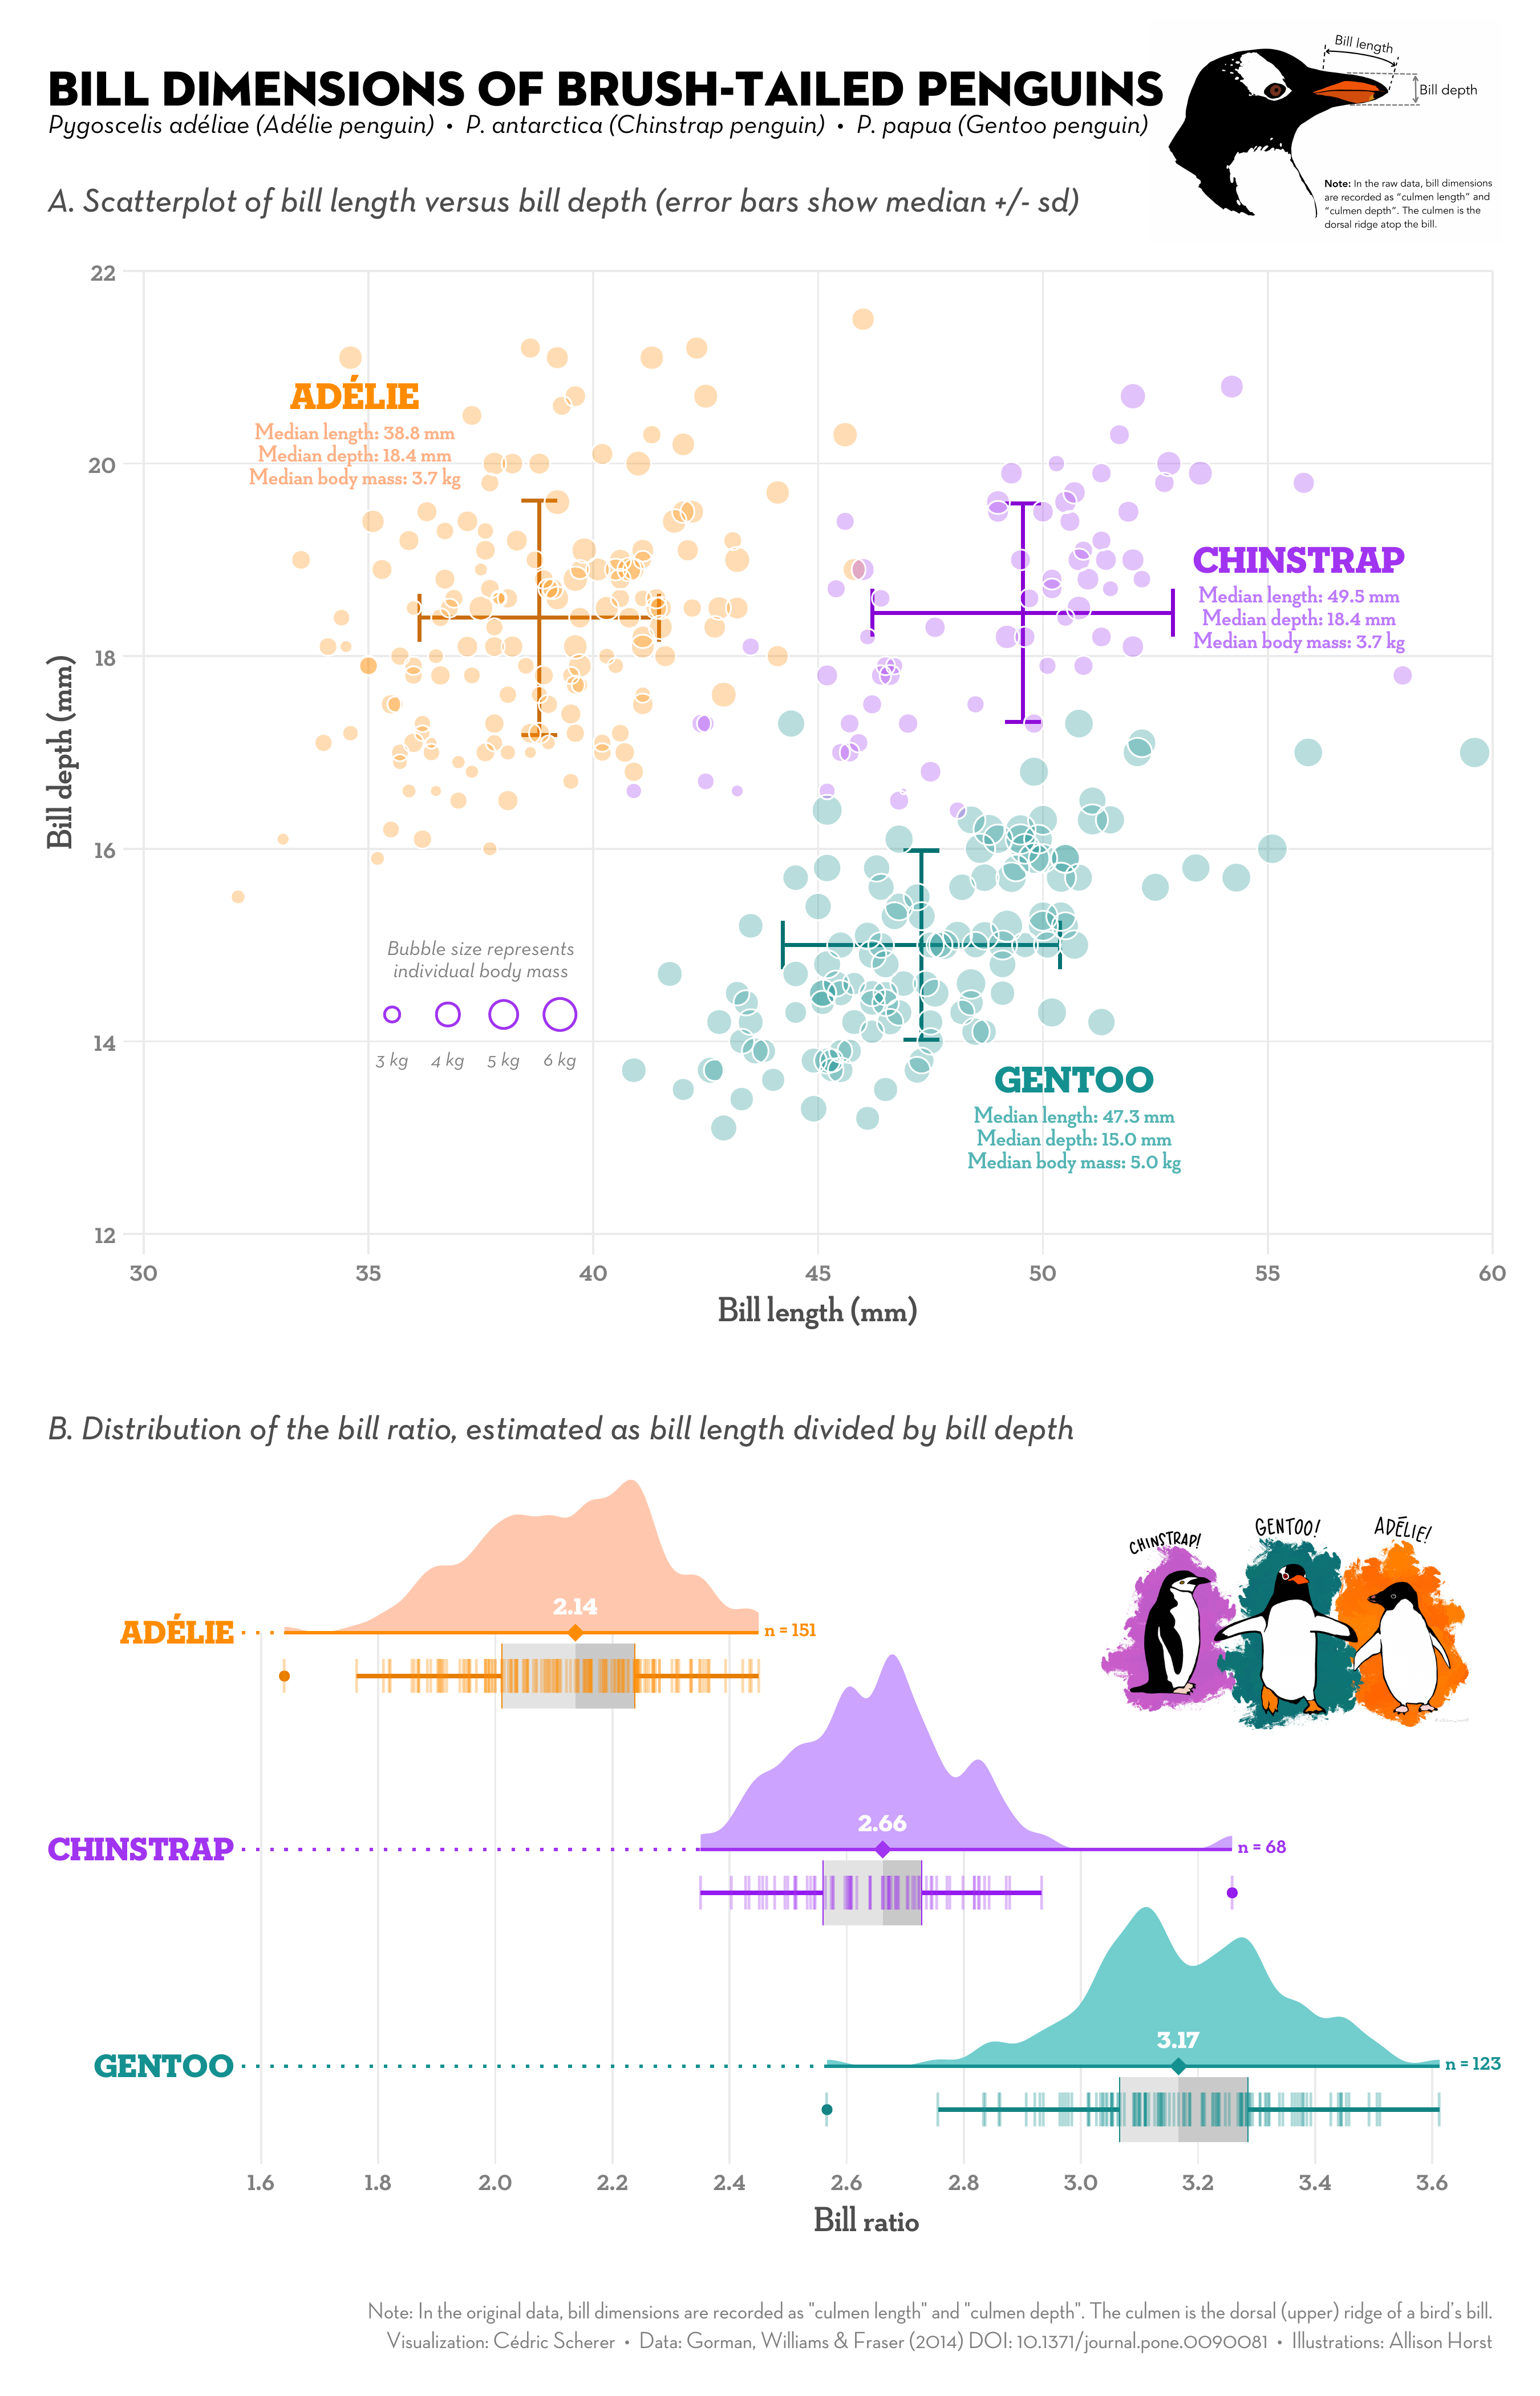
While ggplot2 is powerful, its defaults aren’t always perfect. We’ll cover design principles that enhance both the appeal and informativeness of your figures. This skill is quite useful—after all, figures often make the first impression on your readers. By the end of the course, you’ll be capable of creating figures like this:
1.2.3 The Art of Data Wrangling
In our daily research, data is rarely neat. Before you can start analyzing, you’ll likely spend hours organizing it into a usable format. Fortunately, dplyr and tidyr simplify this process, turning data wrangling into a clear, logical workflow.
To get a quick taste, let us imagine describing your morning routine. In base R, it might look like a convoluted nest of functions:
Or, a series of perplexing intermediate variables:
you_w <- wakeup(you)
you_bw <- brush(you_w)
you_sbw <- shower(you_bw)
...
With dplyr, however, it transforms into a straightforward, logical flow:
you |>
  wakeup() |>
  brush() |>
  shower() |>
  get_dressed() |>
  eat()
In the tidyverse ecosystem, each step of data manipulation is easy to write and, more importantly, easy to follow when reading other people’s code. We’ll introduce you to a core set of verbs—fewer than ten—that will handle over 90% of everyday tasks. You see, coding languages are indeed simpler than human languages!
1.2.4 Scientific typsetting
Yes, Microsoft Word is great. But when it comes to updating figures, managing references, or maintaining consistent layouts, it can quickly turn into a labyrinthine headache. The core issue is that Word is a WYSIWYG editor—What You See Is What You Get (a weird acronym, I know).
The problem with WYSIWYG editors is that they often require manual tweaks—nudging an image here, adjusting a margin there—which not only consumes valuable time but also opens the door to errors. This is why separating content from layout is a strategy worth adopting. Instead of wrestling with formatting, you focus on the substance of your work—the data, the analysis, the insights—and let the tools handle the presentation.
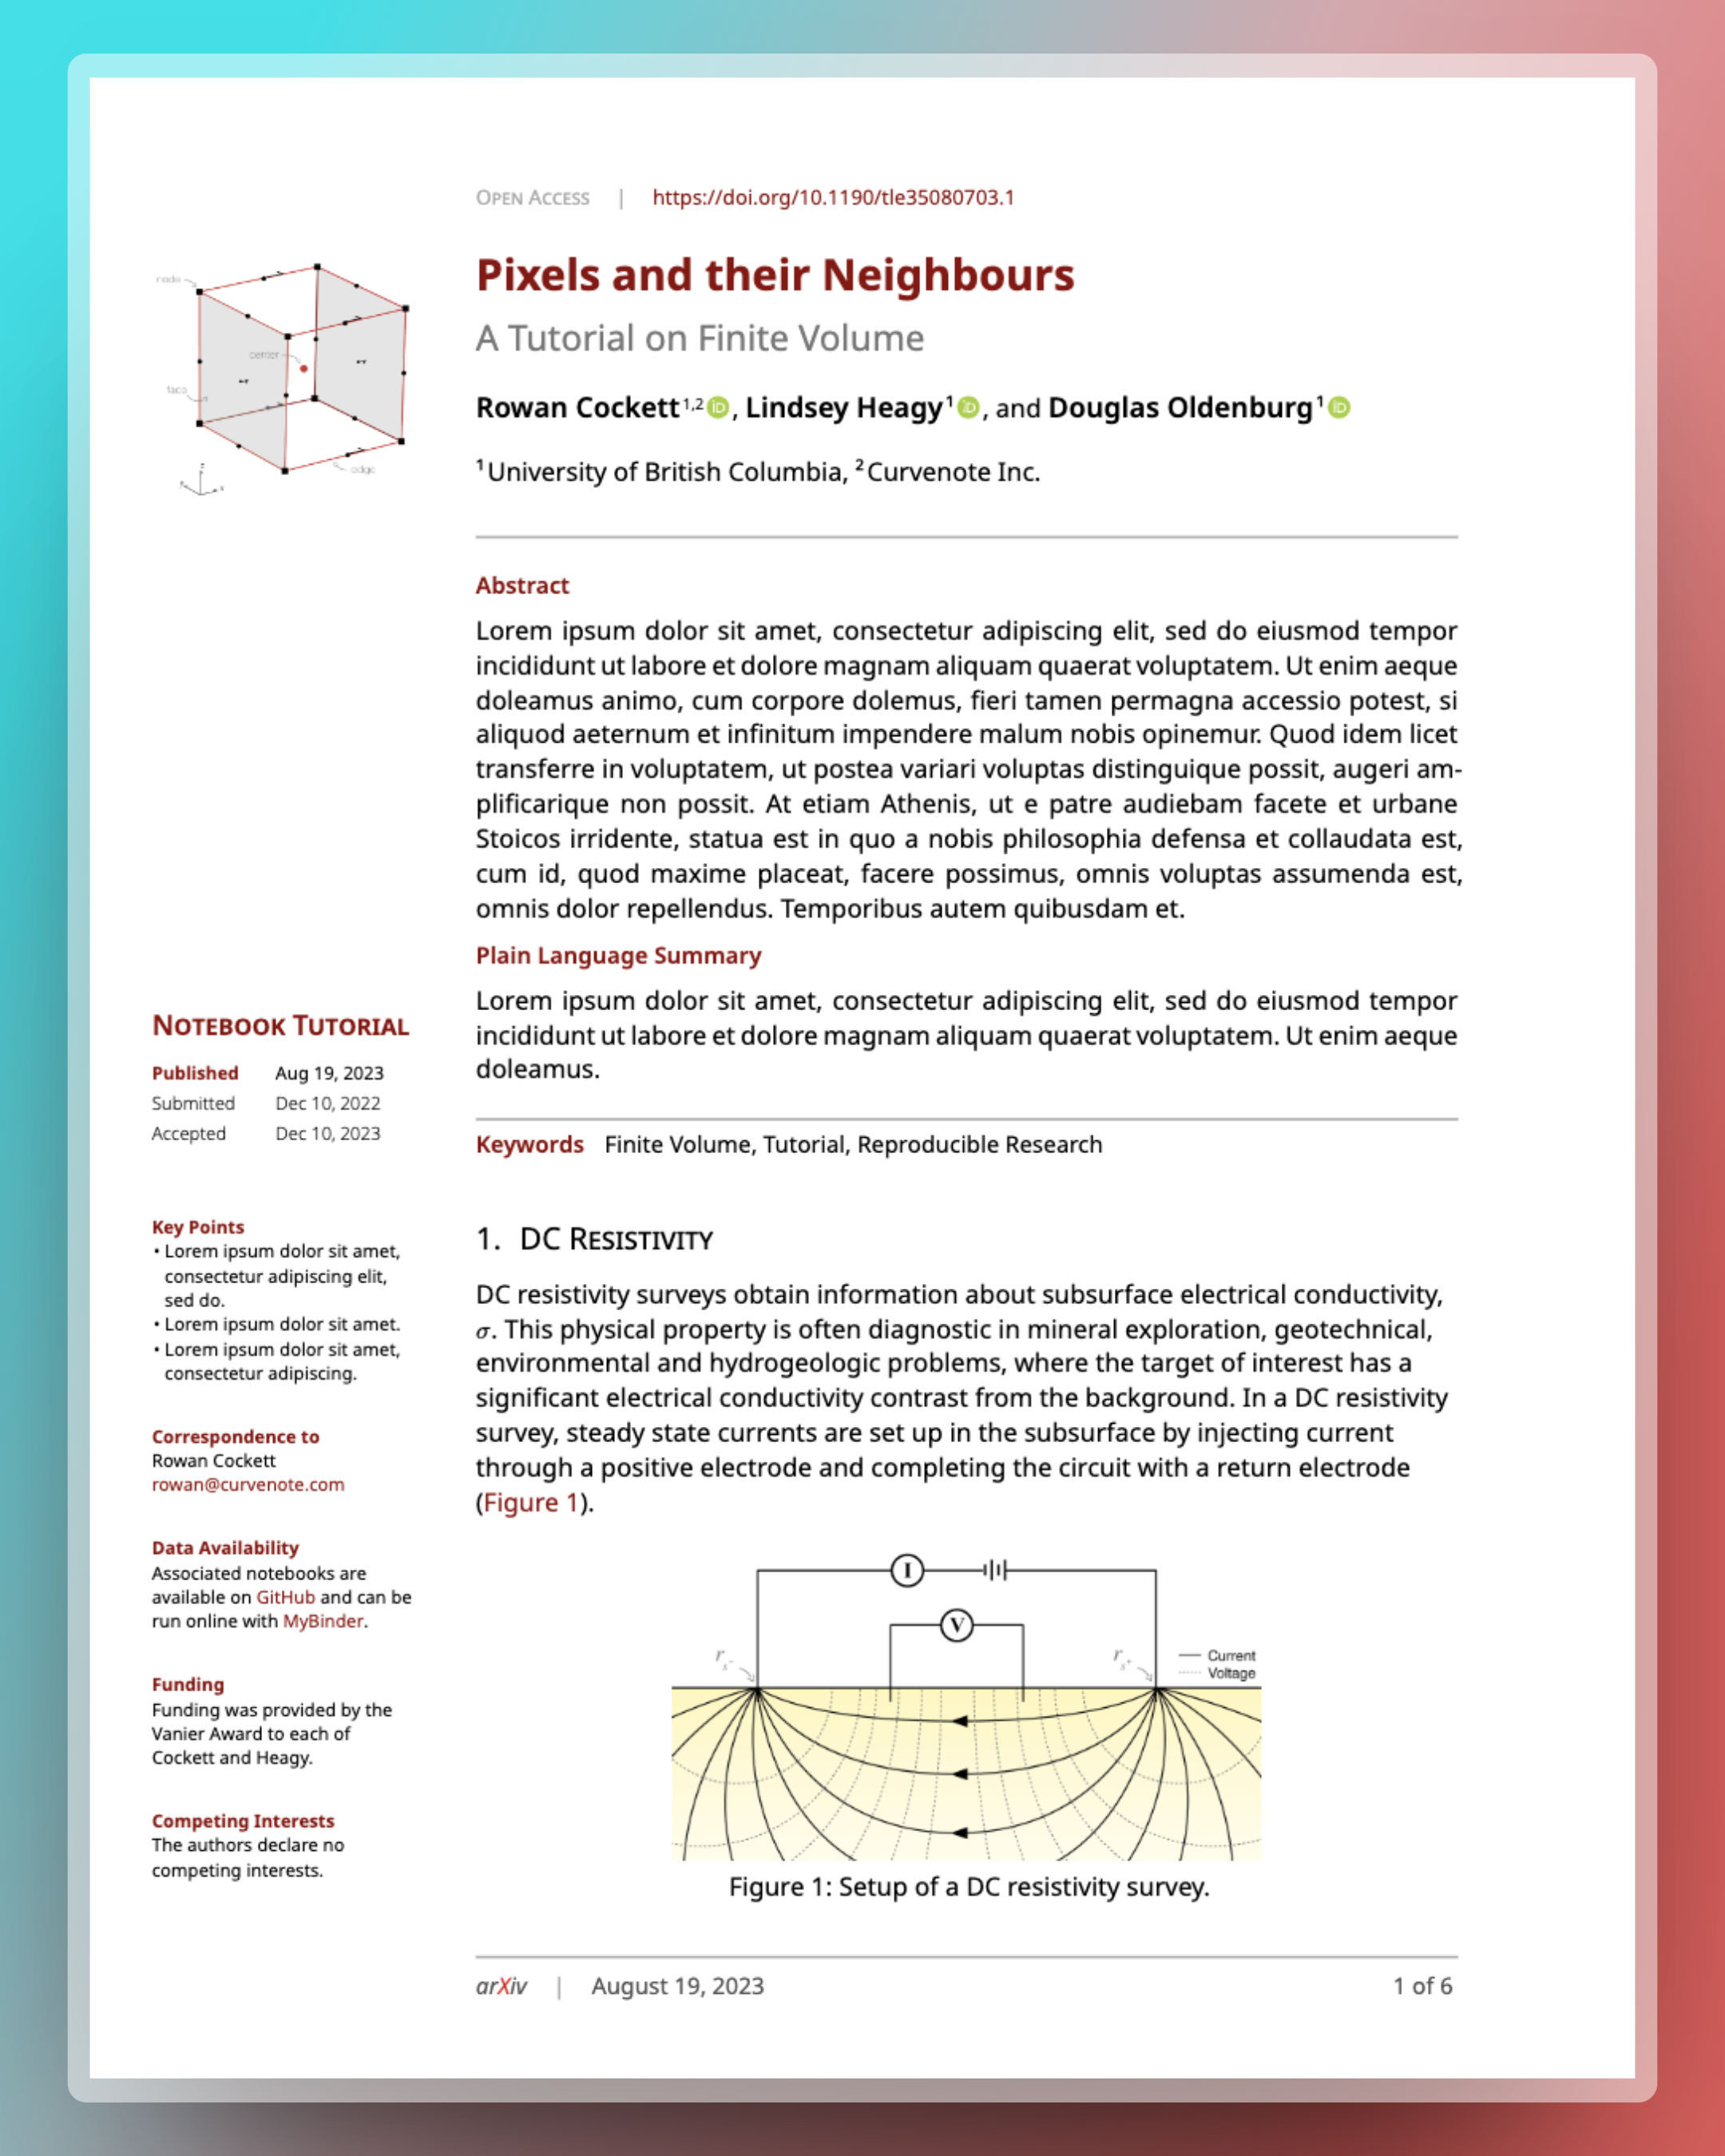
While there are several tools for this purpose (including the notorious LaTeX), we’ll focus on Quarto, a modern document preparation system tailored for researchers. Quarto allows you to seamlessly integrate code, references, and figures, producing professional outputs in submission-ready formats like Word or LaTeX with minimal effort. By the end of this course, you’ll be able to generate documents like this with a single click in R:
Professional Typesetting
While Quarto is powerful, sometimes you need specialized tools for optimal layout. LaTeX is one option, but it can feel outdated and cumbersome. We’ll briefly explore Typst, a modern alternative that offers the sophistication of LaTeX without the steep learning curve. It is also much faster and provided user-friendly interface for bebuggging. I firmlt believe Typst will replace LaTeX in the near future.
1.2.5 Reproducible Research
As a data editor for a journal, I’m often struck by how many papers are challenging to reproduce—which I see as a huge problem for science. In this course, you’ll learn to make your research fully reproducible, which benefits not only the scientific community but also you—it makes it easier to revisit and build upon your work.
We’ll get into version control using Git and GitHub, tools that help you track changes, back up your work, and collaborate effectively. Additionally, we’ll cover specific techniques in R that support reproducible workflows, ensuring your research stands on a solid foundation.
1.3 Course Plan (Tentative)
1.3.1 Introduction to R and RStudio
- Installing R and RStudio
- Navigating the RStudio interface
- Basic R syntax and operations
- Introduction to R packages and the
tidyverse - Basic Data Types:
tibbleandvector
1.3.2 Introduction to ggplot2
- The Grammar of Graphics concept
- Creating basic plots: scatter plots, line graphs, histograms, boxplots
- Customizing plots with aesthetics, themes, and labels
- Saving and exporting plots
1.3.3 Core dplyr Verbs for Data Manipulation
- Using the pipe operator (
|>) for streamlined code -
filter(): subsetting rows based on conditions -
select(): choosing specific columns -
mutate(): creating and transforming variables -
group_by()andsummarize(): aggregating and summarizing data
1.3.4 Advanced ggplot2 Techniques
- Design principles based on Fundamentals of Data Visualization by Claus O. Wilke
- Annotation with
ggrepelandgghighlightfor labeling and highlighting key data - Enhanced text formatting with
ggtext - Multi-panel plots with
patchwork - Interactive plots with
ggiraph - Animated plots with
gganimateto visualize changes over time - Handling overplotting with
ggpointdensityandggdensityfor dense scatter plots - Uncertainty visualization with
ggdistandggridgesmaterial - Applying beautiful themes
- How to adjust figures for presentations
1.3.5 Importing and Cleaning Data
- Importing data with
readr - Cleaning data with
janitor - Handling missing data
- Handling dates with
lubridate - Joining data with
left_join()
1.3.6 Making R Run Faster
- Faster data wrangling with
dtplyrfor speed improvements - Functional programming with
purrr - Parallel computing with
furrrto utilize multiple cores for concurrent execution
1.3.7 Introduction to Quarto
- Setting up Quarto and integrating it with RStudio
- Document structure and YAML metadata
- Blocks and chunk options: controlling code execution and output
- Reference management with
bibtex - Generating outputs: rendering documents to HTML, PDF, and Word formats
1.3.8 Best Practices for Reproducible Research
- Version control with
GitandGitHubusingRStudio - Using
Quartofor reproducible reports: integrating code, analysis, and narrative text - creating reproducible environments and managing dependencies with
renv
1.3.9 How to Use AI in Coding
- Introduction to
GitHub Copilot
1.4 What We Won’t Cover
There’s a vast universe of computing out there, and we have to draw the line somewhere (before we all get lost in a black hole of code). There’s a reason why programmers in the Silicon Valley are paid so well—computing is hard! Here are some intriguing areas we won’t cover in this course, but I encourage you to explore them in the future:
Advanced Statistics and Machine Learning: These areas are extensive and deserve dedicated courses. To dive deeper into the world of algorithms and data models, I’d recommend starting with Tidymodels, which shares the same design philosophy as the
tidyverseand should make for a smooth transition.Writing R Packages: Creating your own R packages is super useful, but might be overkill for our current adventure. If you’re interested in trying this, check out Hadley Wickham’s book R Packages as a starting point.
High-Performance Computing and Big Data Analytics: Working with massive datasets and supercomputers is exciting (who doesn’t want to feel like they’re in a NASA control room?), but it often requires specialized knowledge and environment-specific setups. Plus, ecological datasets aren’t usually large enough to make your laptop break a sweat. We’ll stick to tools that run on a standard machine. If you’re eager to unleash the Kraken of computing power, UCLA’s Hoffman2 Cluster has you covered with detailed guidelines.
Building Personal Websites: Maintaining a professional personal website is important for academics—it’s like your digital business card. Quarto makes it quite easy to set one up, but we won’t cover the details in this course. If you’re intrested, I’d recommend exploring the Quarto documentation on making websites.
Other Programming Languages: Python, Julia, and friends are like the enticing dessert menu after a big meal—tempting but perhaps best saved for another time. As mentioned earlier, transitioning from R to Julia is relatively straightforward, so you can always explore other languages when you’re ready to expand your coding palate.