pak::pak(c("microbenchmark", "tictoc", "dtplyr", "duckplyr", "mirai", "furrr"))20 Making R Faster 🚀
Class Objectives
- Measure your code’s speed – Know exactly how fast (or slow) your code is running
- Parallel computing magic – Get free speed boosts by using multiple CPU cores
- Turbocharge your data wrangling – Swap tidyverse functions with faster engines under the hood.
Packages for this chapter
If you haven’t installed the following packages, run this code:
R sometimes gets a bad rap for being slower than languages like C++ or Julia. That’s partly true: if you are really serious about performance, you might want to learn another language. However, you can make R much faster without rewriting your code or learning a new language.
Let’s start by loading tidyverse and a dataset from the nycflights13 package which has more than 330,000 rows.
library(tidyverse)
data(flights, package = "nycflights13")
Note that we are not using the tidylog package this time. tidylog marks up the verbs with comments so that you know what happens in each step. This is great for understanding what the code is doing, but it slows down the execution.
20.1 Figure Out How Fast Your Code Is
20.1.1 Quick Check with tictoc
The tictoc package (no relation to social media platform) lets you time code chunks easily:
library(tictoc)
tic()
model_r2 <- flights |>
group_by(carrier, origin, year) |>
nest() |>
mutate(r2 = map_vec(data, \(x) summary(lm(arr_delay ~ dep_delay, data = x))$r.squared))
toc()- 1
- Start the timer!
- 2
-
Your code goes in between
tic()andtoc(). - 3
- Stop the timer and print the time
10.168 sec elapsed20.1.2 Compare Methods with microbenchmark
Want to test multiple approaches? microbenchmark runs code repeatedly and compares results:
library(microbenchmark)
benchmark <- microbenchmark(
method_rowwise = flights |>
group_by(carrier, origin, year) |>
nest() |>
rowwise() |>
mutate(r2 = summary(lm(arr_delay ~ dep_delay, data = data))$r.squared) |>
ungroup(),
method_map = flights |>
group_by(carrier, origin, year) |>
nest() |>
mutate(r2 = map_vec(data, \(x) summary(lm(arr_delay ~ dep_delay, data = x))$r.squared))
,
times = 10
)
print(benchmark)- 1
- Name the method on the left and the code on the right.
- 2
- Use another method
- 3
- Run each code 10 times
- 4
- Print the time it took to run each method
Unit: milliseconds
           expr      min       lq     mean   median       uq       max neval
 method_rowwise 493.0539 560.0580 735.9991 696.3926 877.0005 1244.8997    10
     method_map 480.5677 508.0887 627.2537 565.7765 741.7879  942.3632    10
 cld
   a
   a
It might be helpful to visualize the results. You can use the autoplot function to do this easily.
autoplot(benchmark)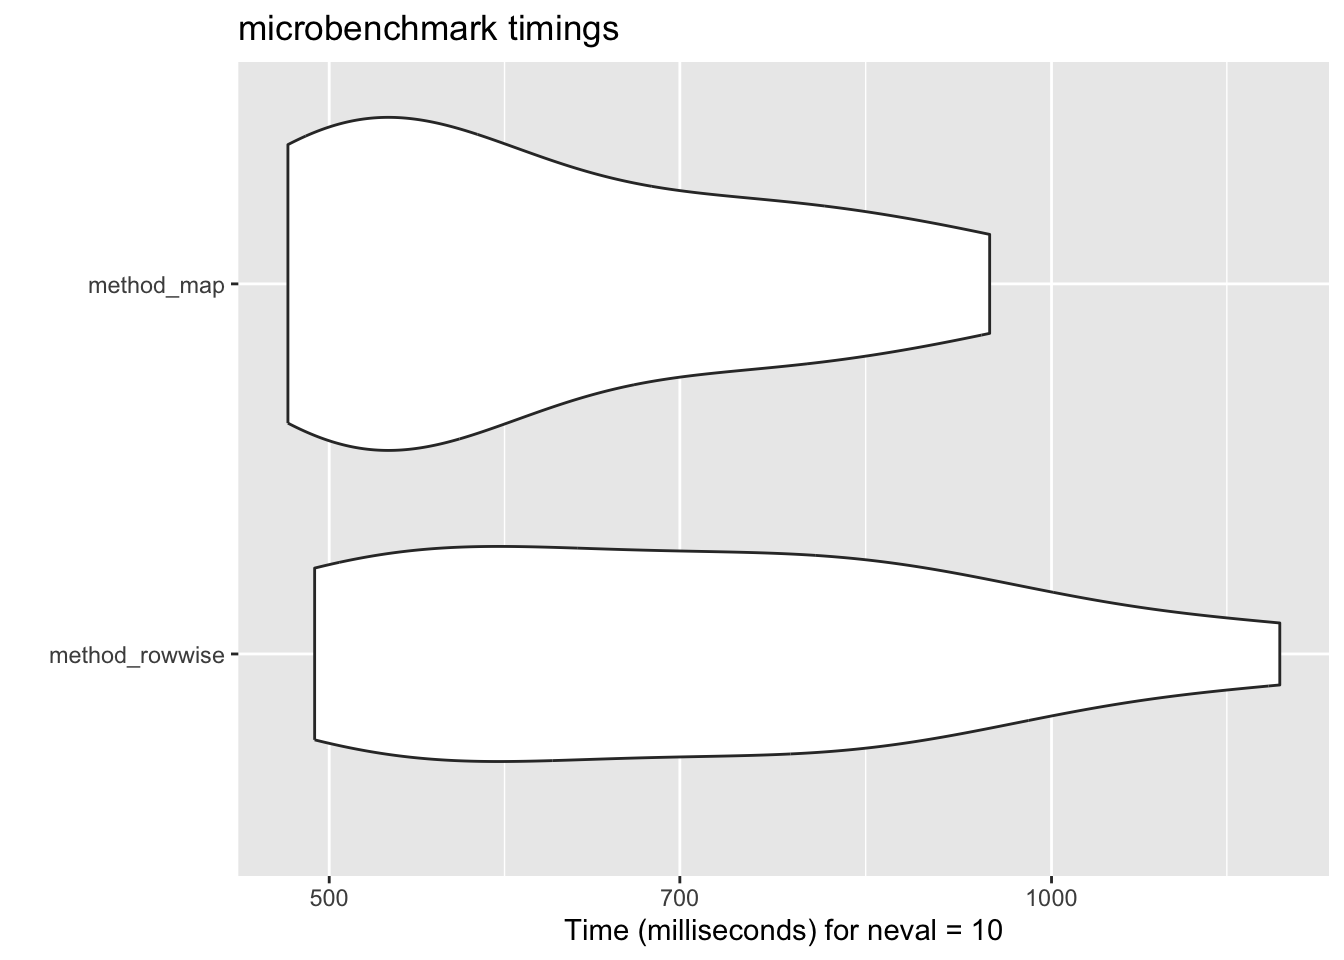
20.1.3 Estimate how long it will take to run your code
A great new feature in purrr is the introduction of .progress argument. This allows you to estimate how long it will take to run your code.
As the codes above runs very fast, we use a more time-consuming task (just for illustration purposes).
tibble(x = 1:500) |>
mutate(y = map_dbl(x, \(x) {
Sys.sleep(0.01)
x
},
.progress = TRUE))- 1
- Sleep for 0.01 seconds
- 2
- Show a progress bar
20.2 Parallel Computing
R usually uses one CPU core. But most computers have 4-8 cores! By sending the same task to multiple cores, you get automatic speedups for free!
Since purrr 1.1.0, parallel computing is built right into the map functions via the mirai package. The syntax change is minimal: just wrap your function with in_parallel() and set up mirai::daemons() beforehand.
library(mirai)
parallelly::availableCores()
daemons(4)
tic()
model_r2 <- flights |>
group_by(carrier, origin, year) |>
nest() |>
mutate(r2 = map_dbl(data,
in_parallel(\(x) summary(lm(arr_delay ~ dep_delay, data = x))$r.squared)))
toc()
daemons(0)- 1
- Check how many cores are available
- 2
- Set the number of daemons (workers). Leave one core for the main process.
- 3
-
Wrap the function with
in_parallel()— that’s it! - 4
- Reset daemons when done
The key idea: in_parallel() is an adverb that signals purrr to run the function across multiple cores. It also ensures your function is self-contained and properly packaged to be sent to parallel processes. If daemons() is not set, it falls back to sequential processing — so your code never breaks.
Note: Parallelizing adds some overhead (think of the leader needs time to coordinate the workers). Thus, it may cost more time than the non-parallelized version for small datasets or quick calculations.
The old way:
furrr
Before mirai was integrated into purrr, the standard approach was the furrr package. You may still see this in older code. The idea is the same: replace map with future_map and set a plan.
library(furrr)
plan(multisession, workers = 4)

tic()
model_r2 <- flights |>
  group_by(carrier, origin, year) |>
  nest() |>
  mutate(r2 = future_map_dbl(data, \(x) summary(lm(arr_delay ~ dep_delay, data = x))$r.squared))
toc()
mirai is generally faster and simpler, so prefer in_parallel() for new code.
20.3 Swap Tidyverse for Speed Demons
data.table is blazing fast but has a steep learning curve. dtplyr lets you write tidyverse code that gets translated to data.table behind the scenes:
library(dtplyr)
flights |>
lazy_dt() |>
group_by(carrier, origin, year) |>
summarise(mean_arr_delay = mean(arr_delay, na.rm = TRUE)) |>
as_tibble()- 1
- Convert the tibble to a data table
- 2
-
Use all the
dplyrfunctions you know - 3
- Convert the data table back to a tibble
DuckDB is a fast database engine, which works super well if you have a lot of data (like millions of rows). duckplyr is a package that translates dplyr code to duckdb code behind the scenes. So again, you can write as usual and do not need to worry about the underlying heavy machinery.
The messages when you load the package clealy tell you that the dplyr functions are overridden.
library(conflicted)
library(duckplyr)- 1
- Resolve conflicts
- 2
-
Load the package and override the
dplyrfunctions
✔ Overwriting dplyr methods with duckplyr methods.
ℹ Turn off with `duckplyr::methods_restore()`.
Then we just do what we always do.
flights |>
  group_by(carrier, origin, year) |>
  summarize(mean_arr_delay = mean(arr_delay, na.rm = TRUE))
20.4 Additional Resources
Making code faster is a very broad topic. Here are some additional resources that you need even more speed:
All of these packages are under active development, and it is hard to say which one is the best (they all have their own strengths). The good news is that they all follow the tidyverse grammar (so very mild learning curve).
20.5 Remember: Speed Isn’t Everything! 🛑
Premature optimization is the root of all evil. – Donald Knuth
Only optimize code that’s slow enough to annoy you. Focus on correctness and readability first!