library(ggplot2)
library(palmerpenguins)
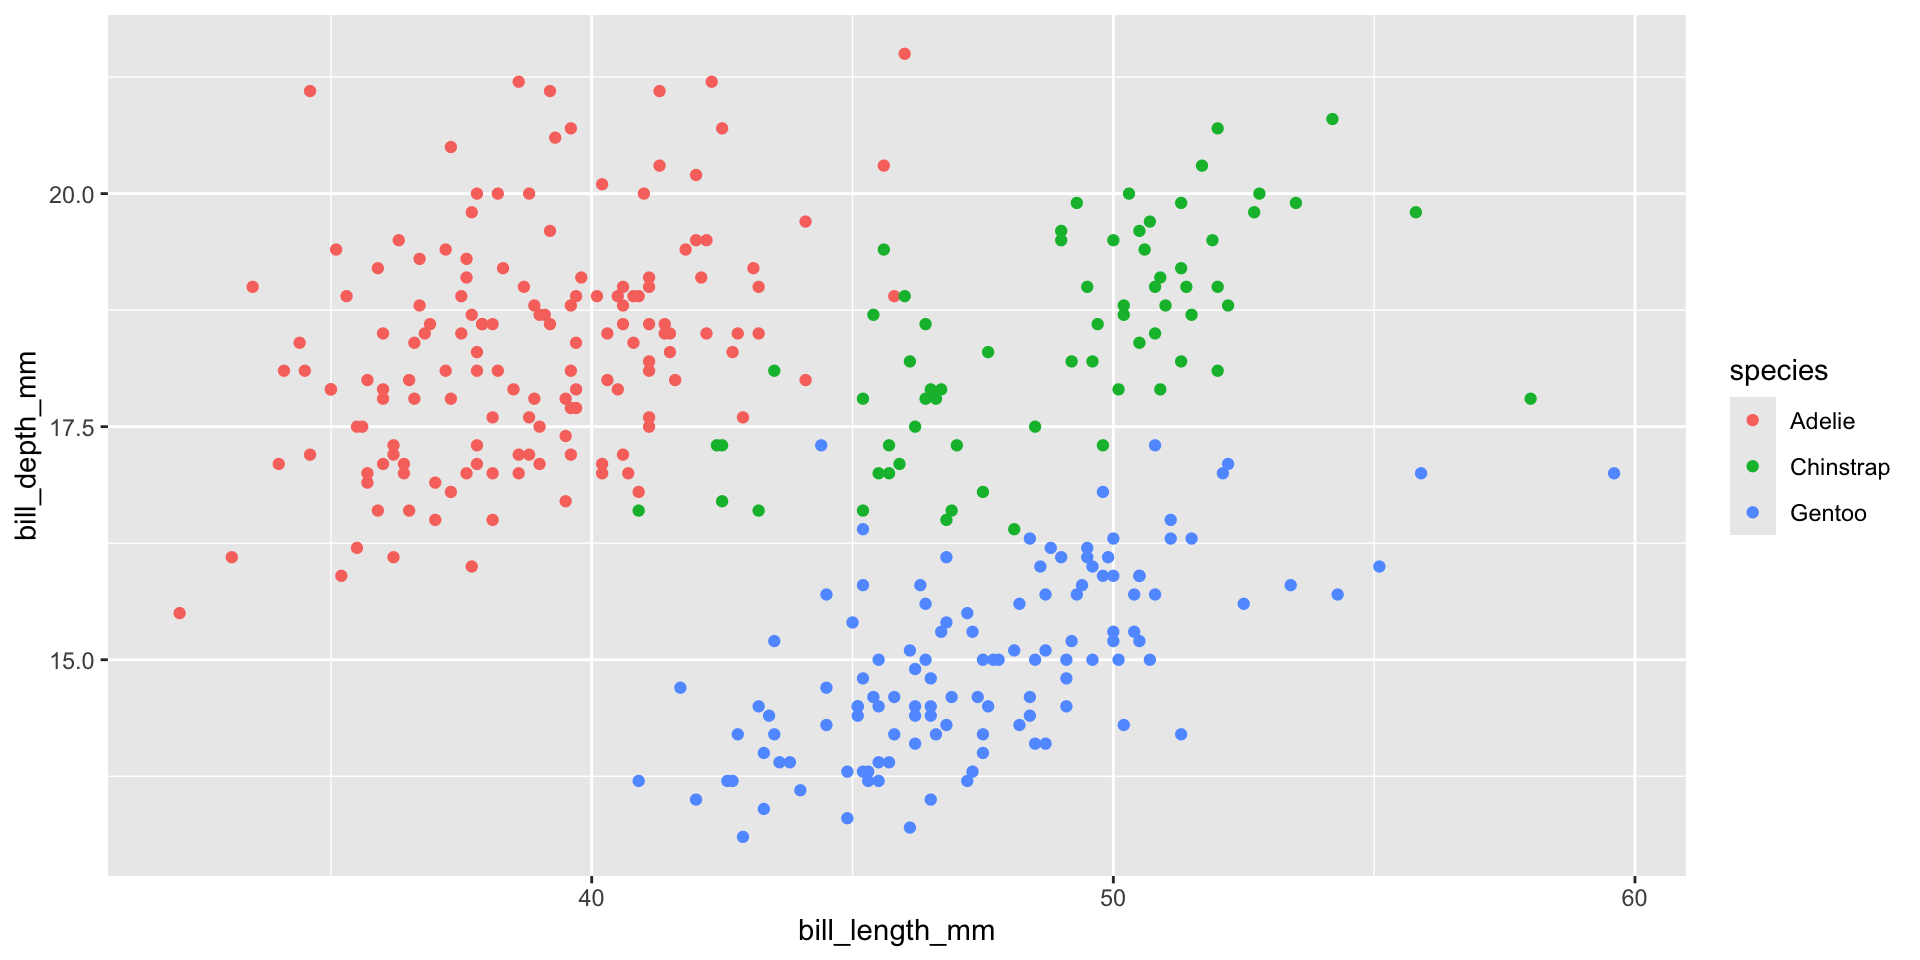
ggplot(
data = penguins,
aes(x = bill_length_mm, y = bill_depth_mm)
) +
geom_point()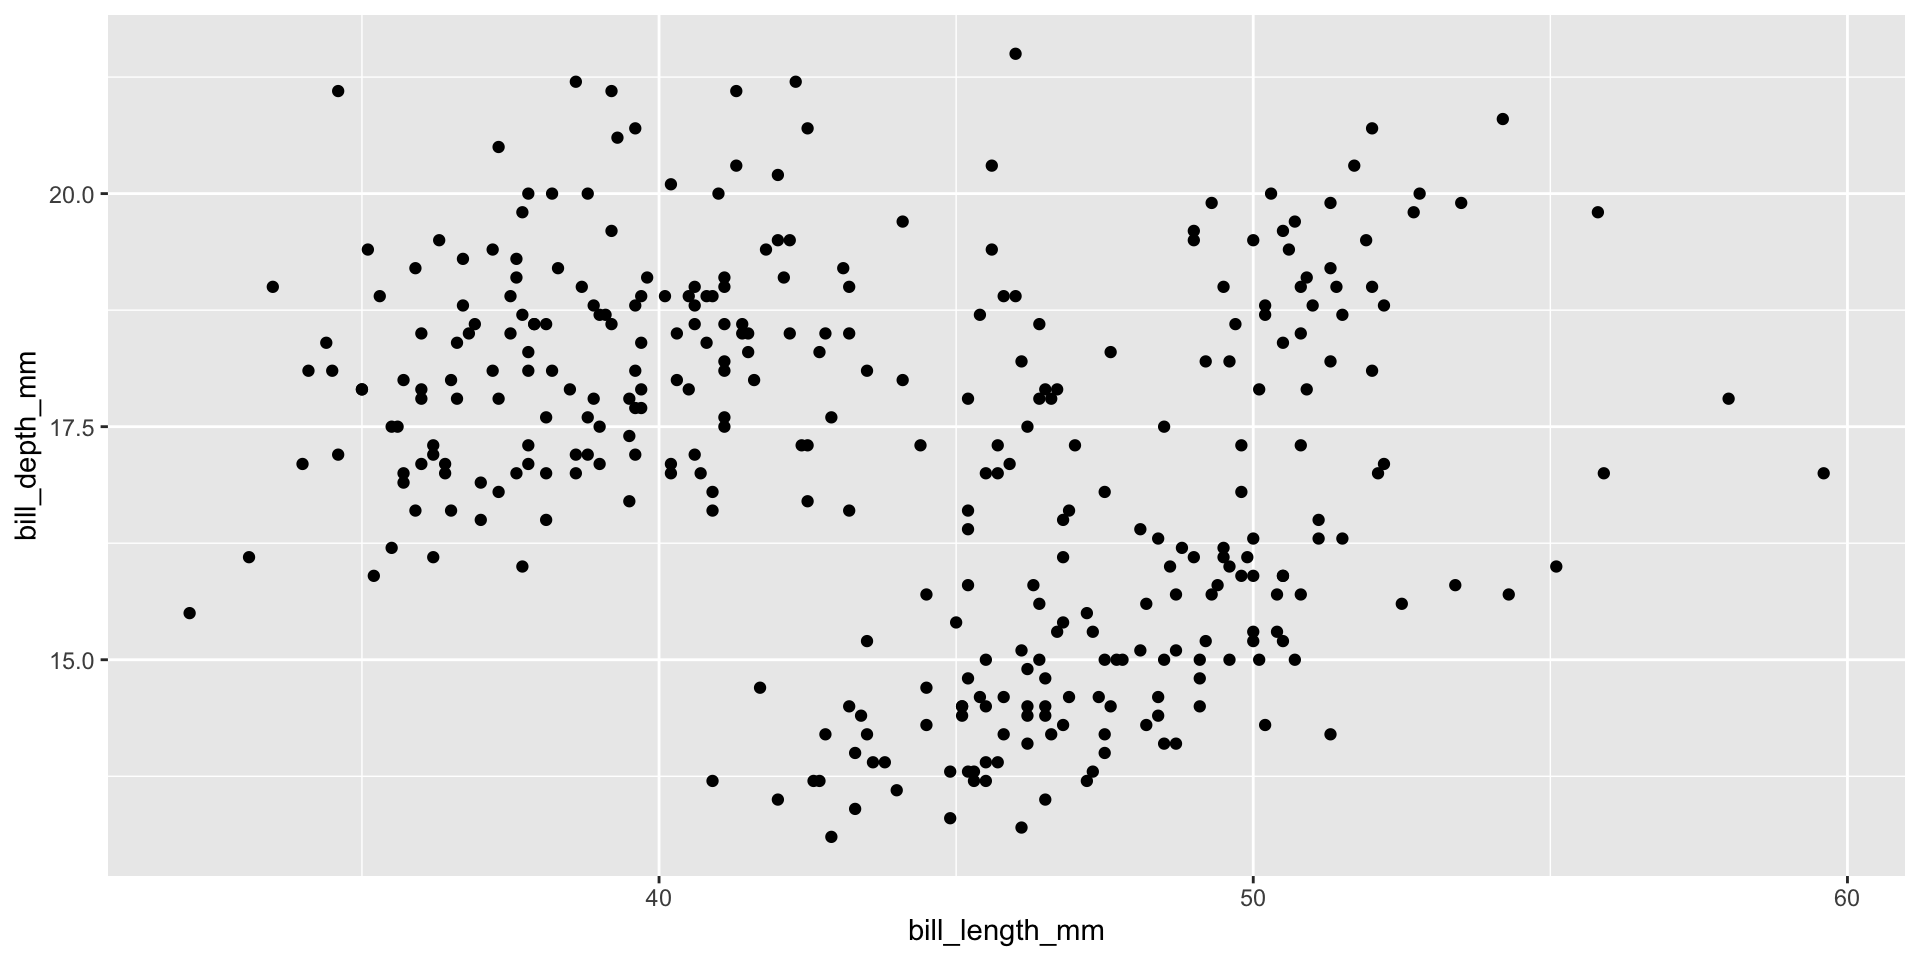
EE BIOL C177/C234
ggplot2
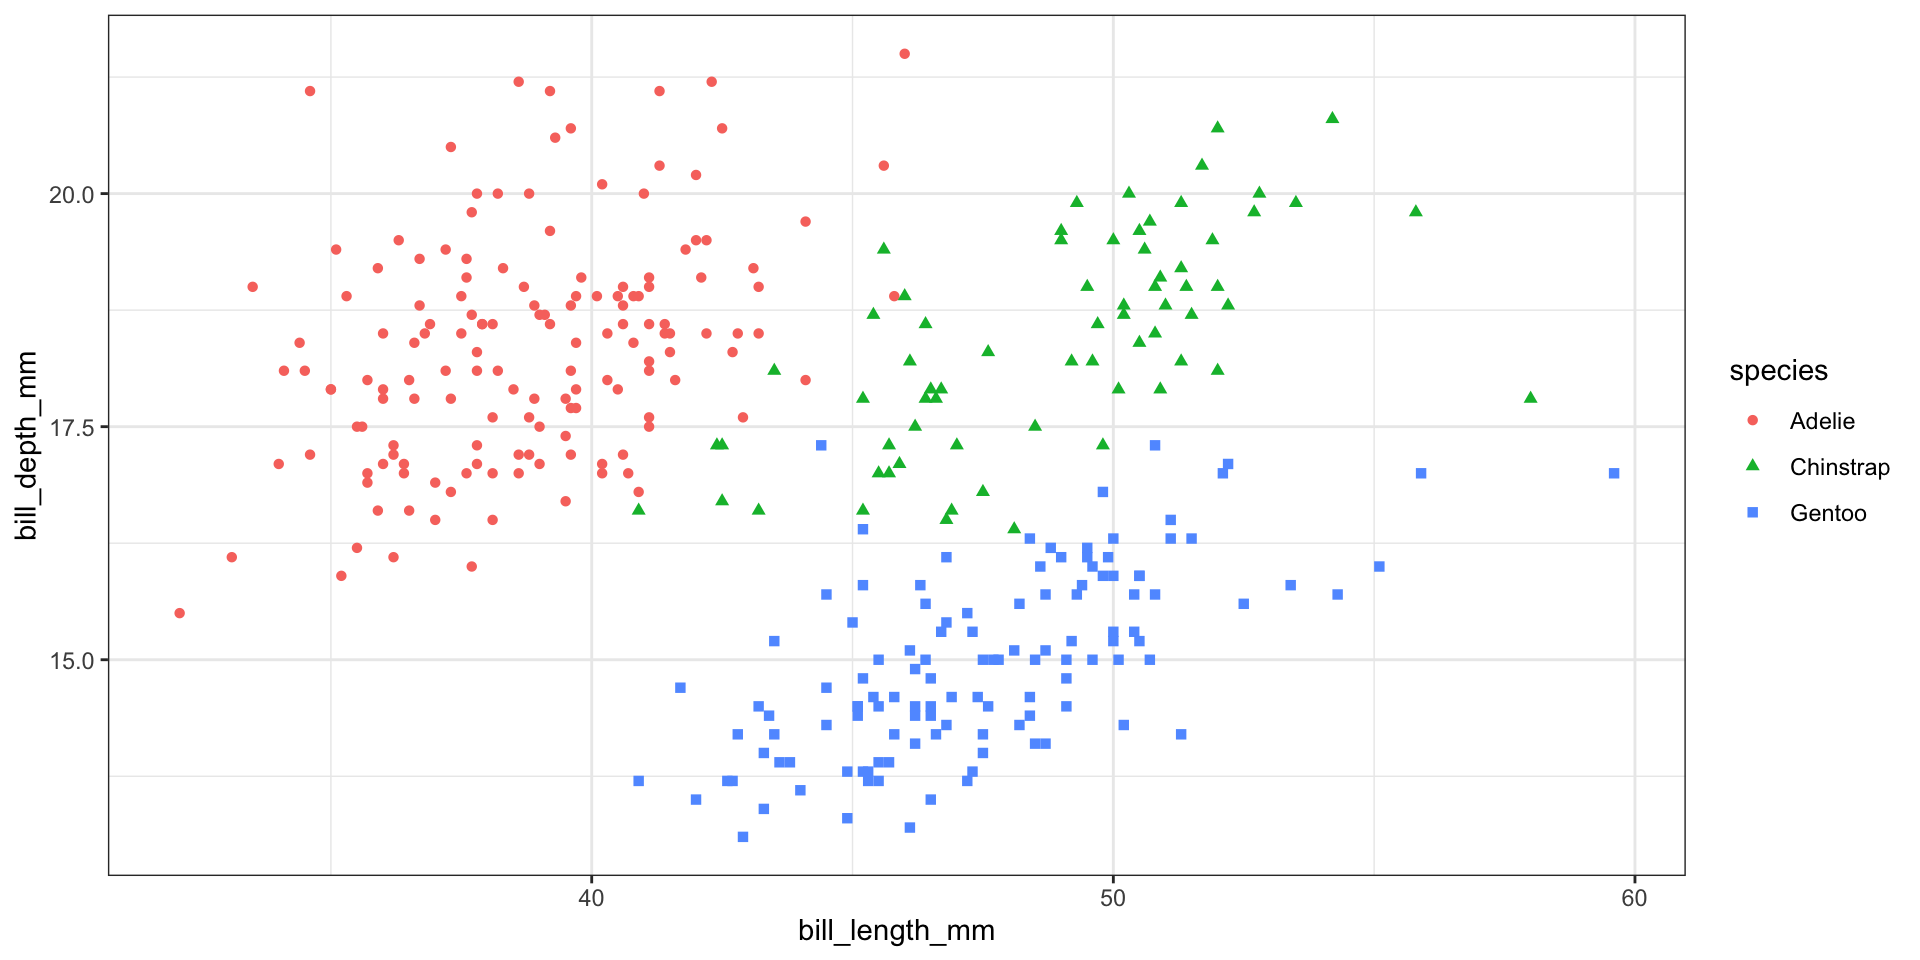
The grey background wastes ink and looks bland. Use theme_bw():
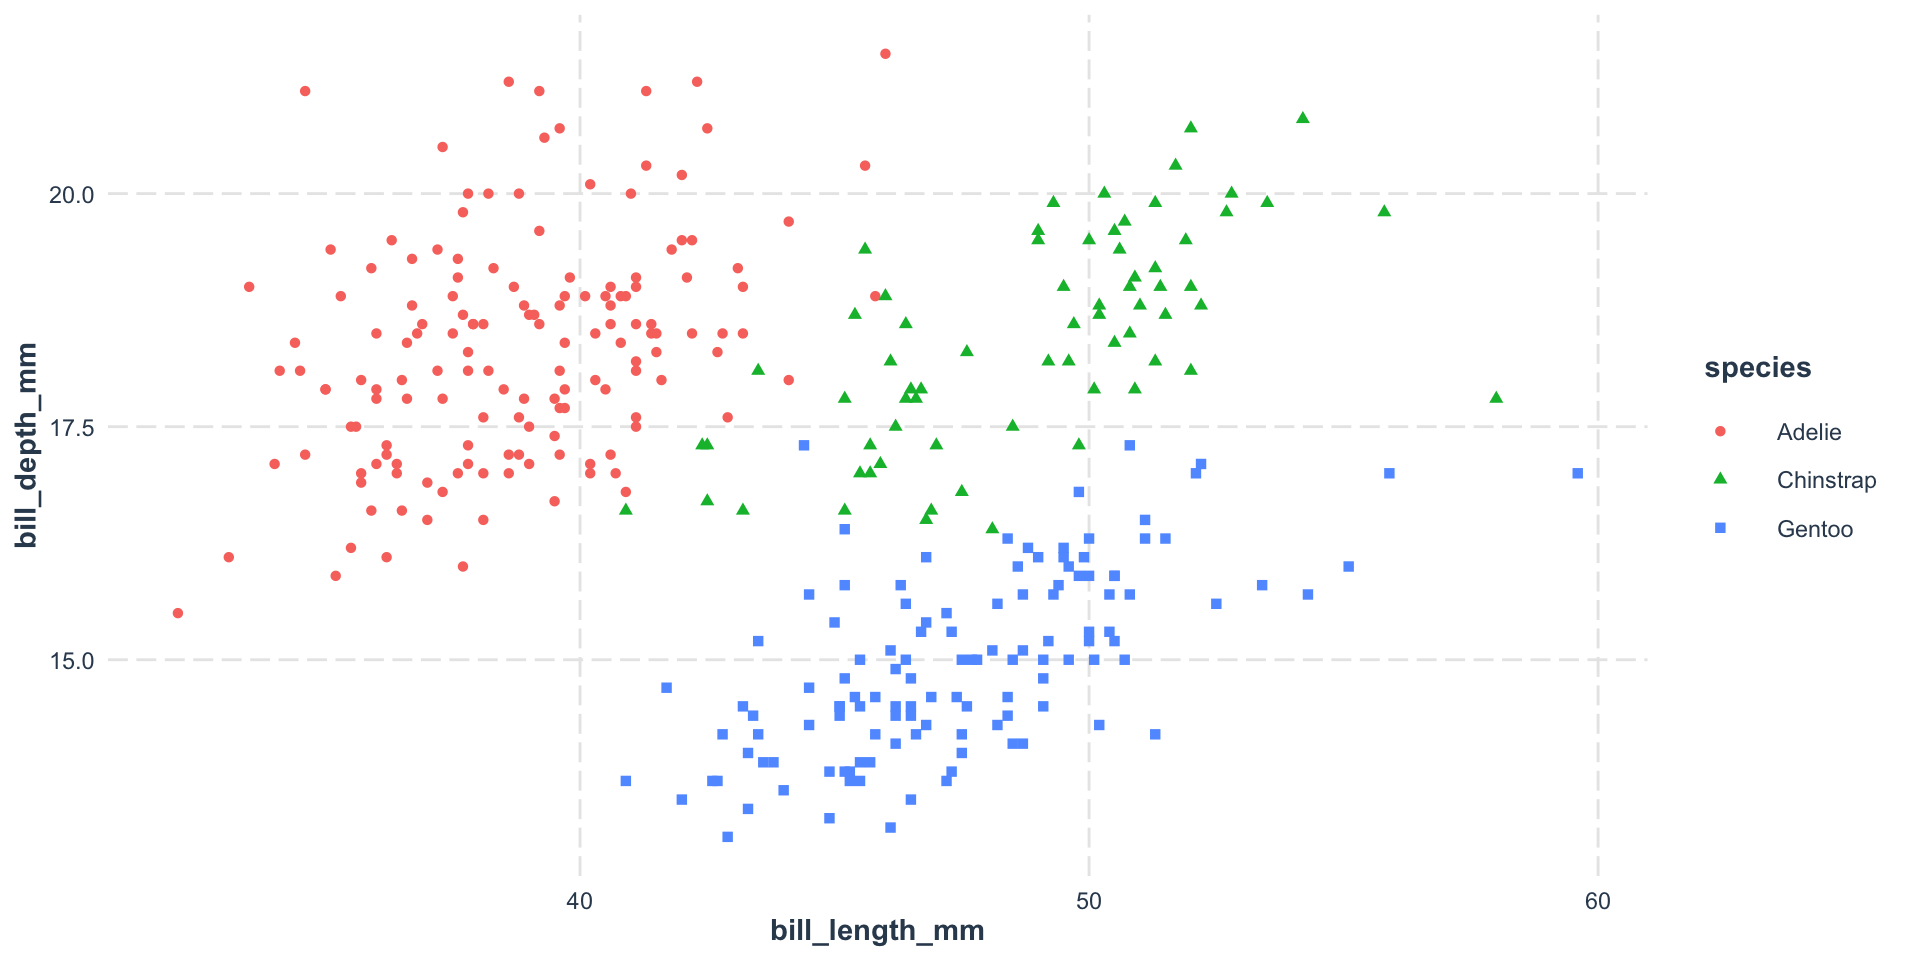
Try theme_minimal(), theme_classic(), or packages like jtools: