Course Introduction
EE BIOL C177/C234
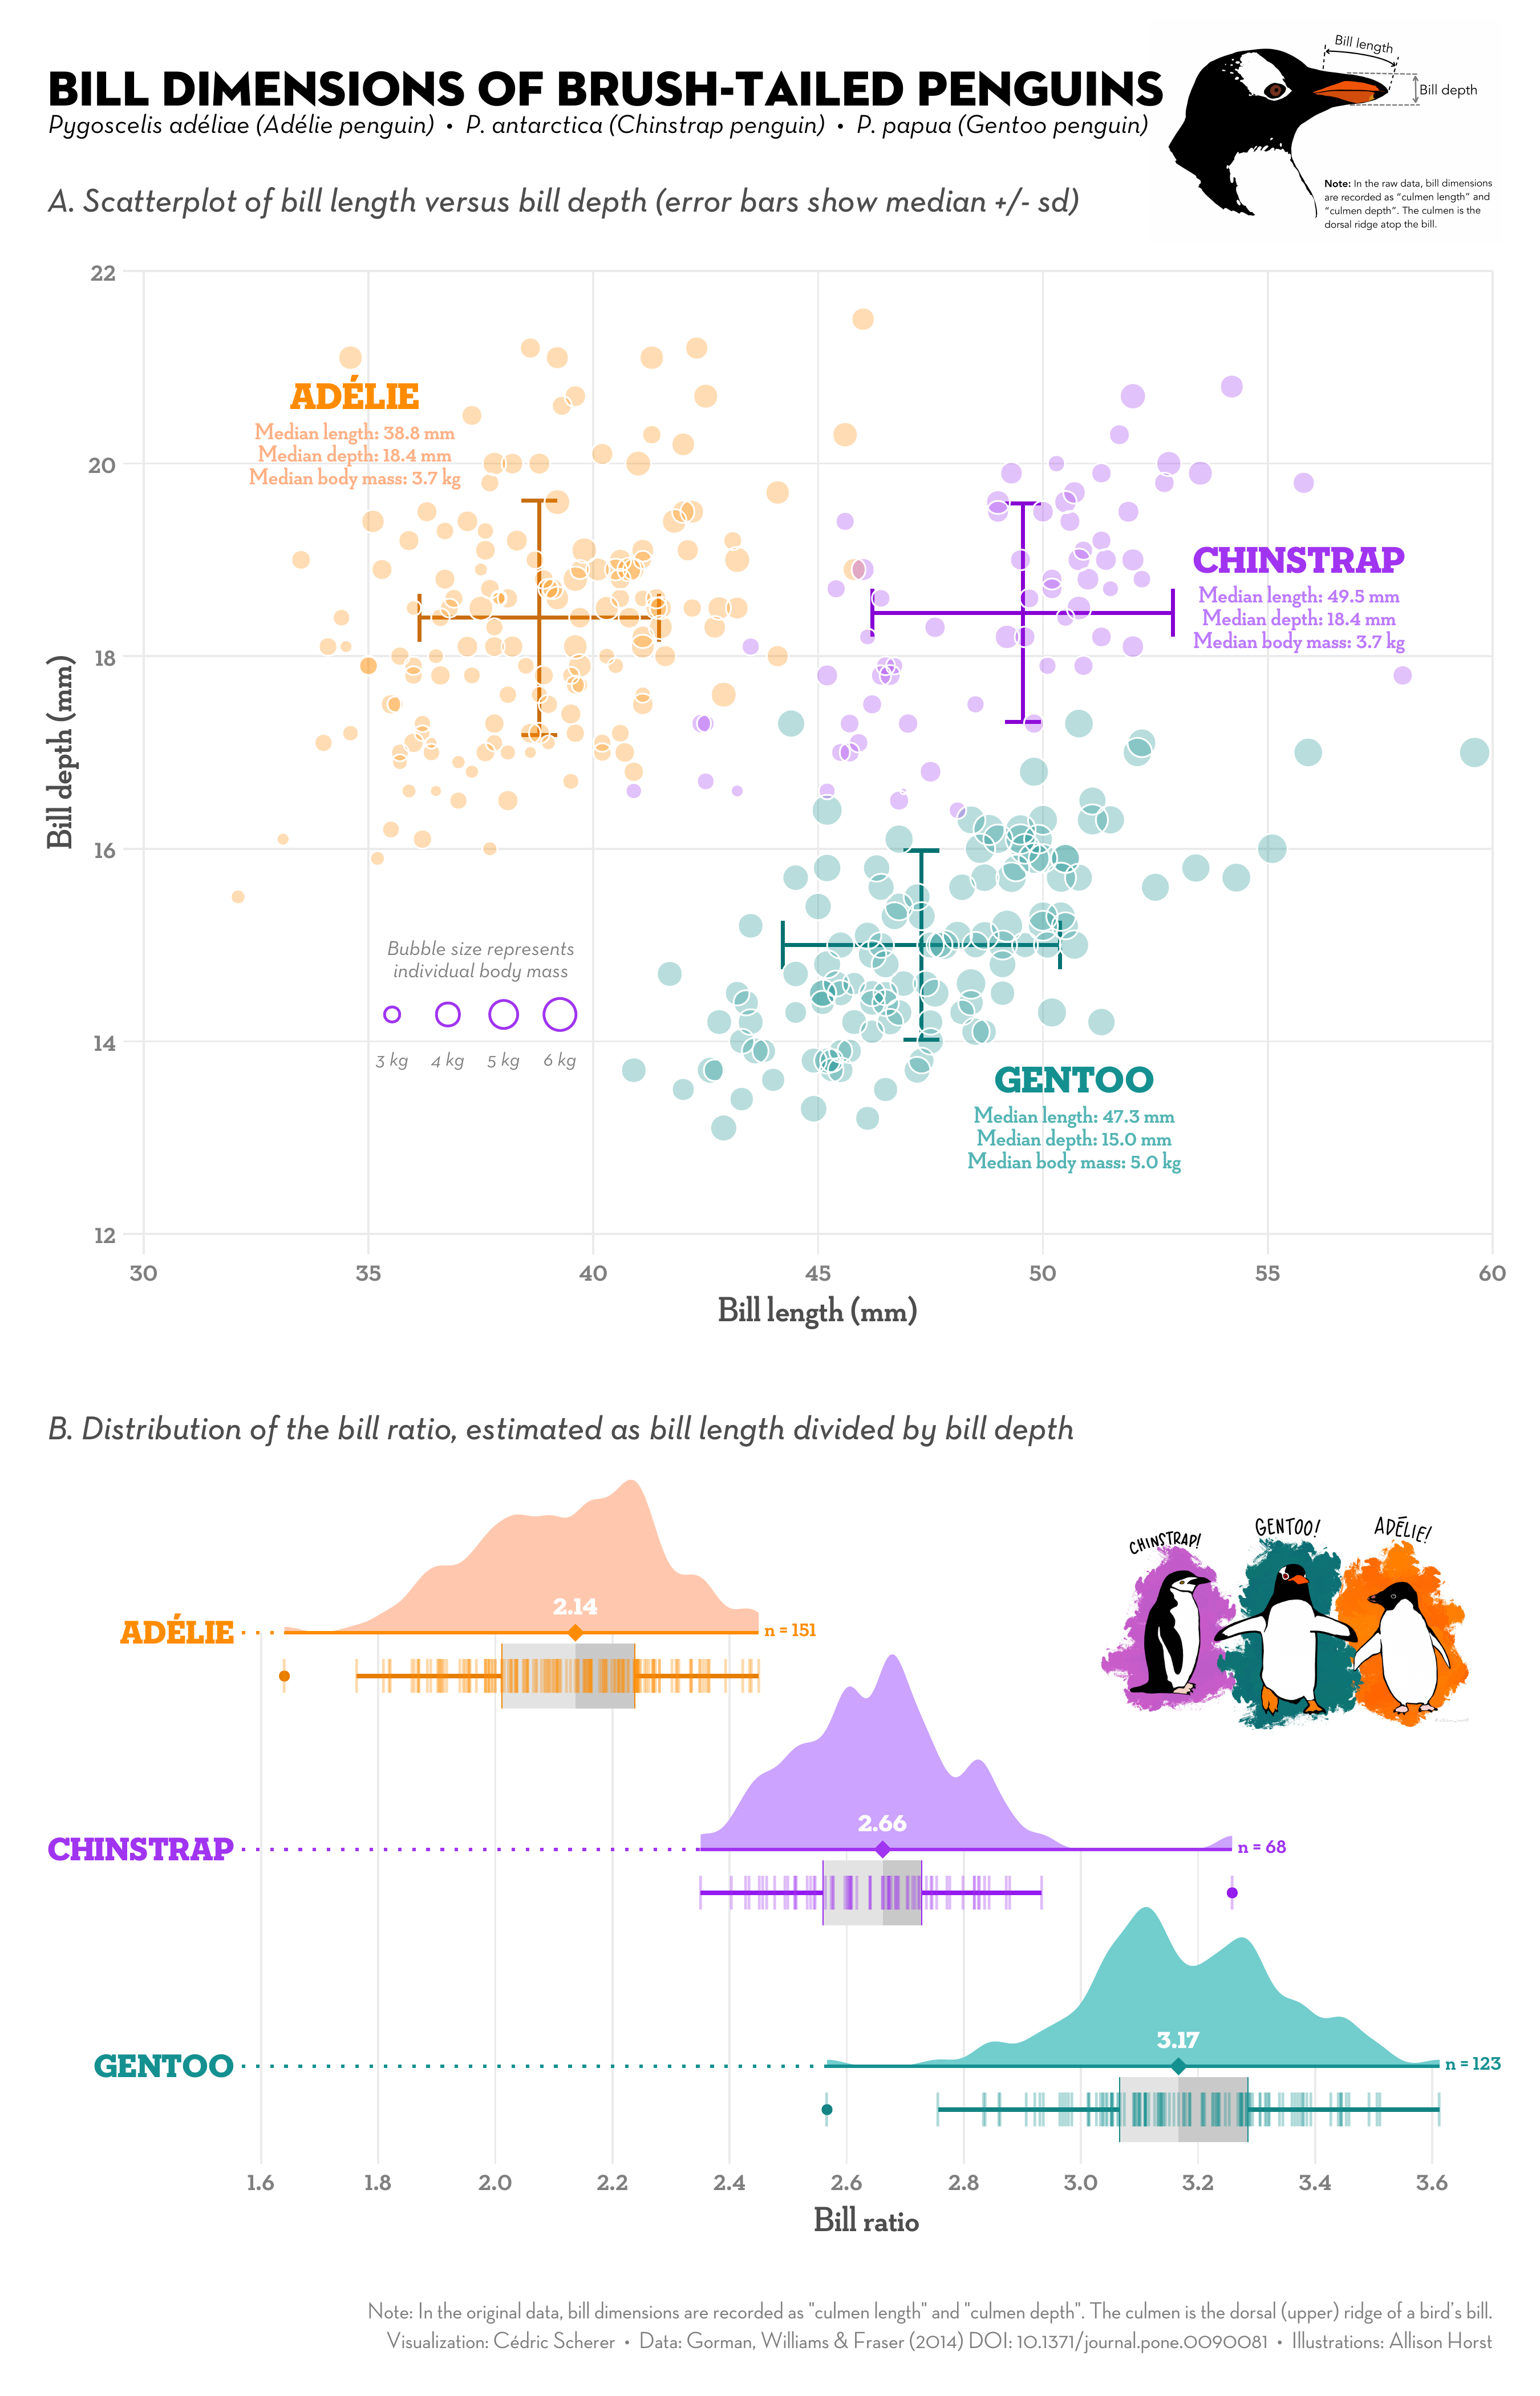
Publication-Ready Figures 📊
With ggplot2 you’ll create structured, beautiful visualizations
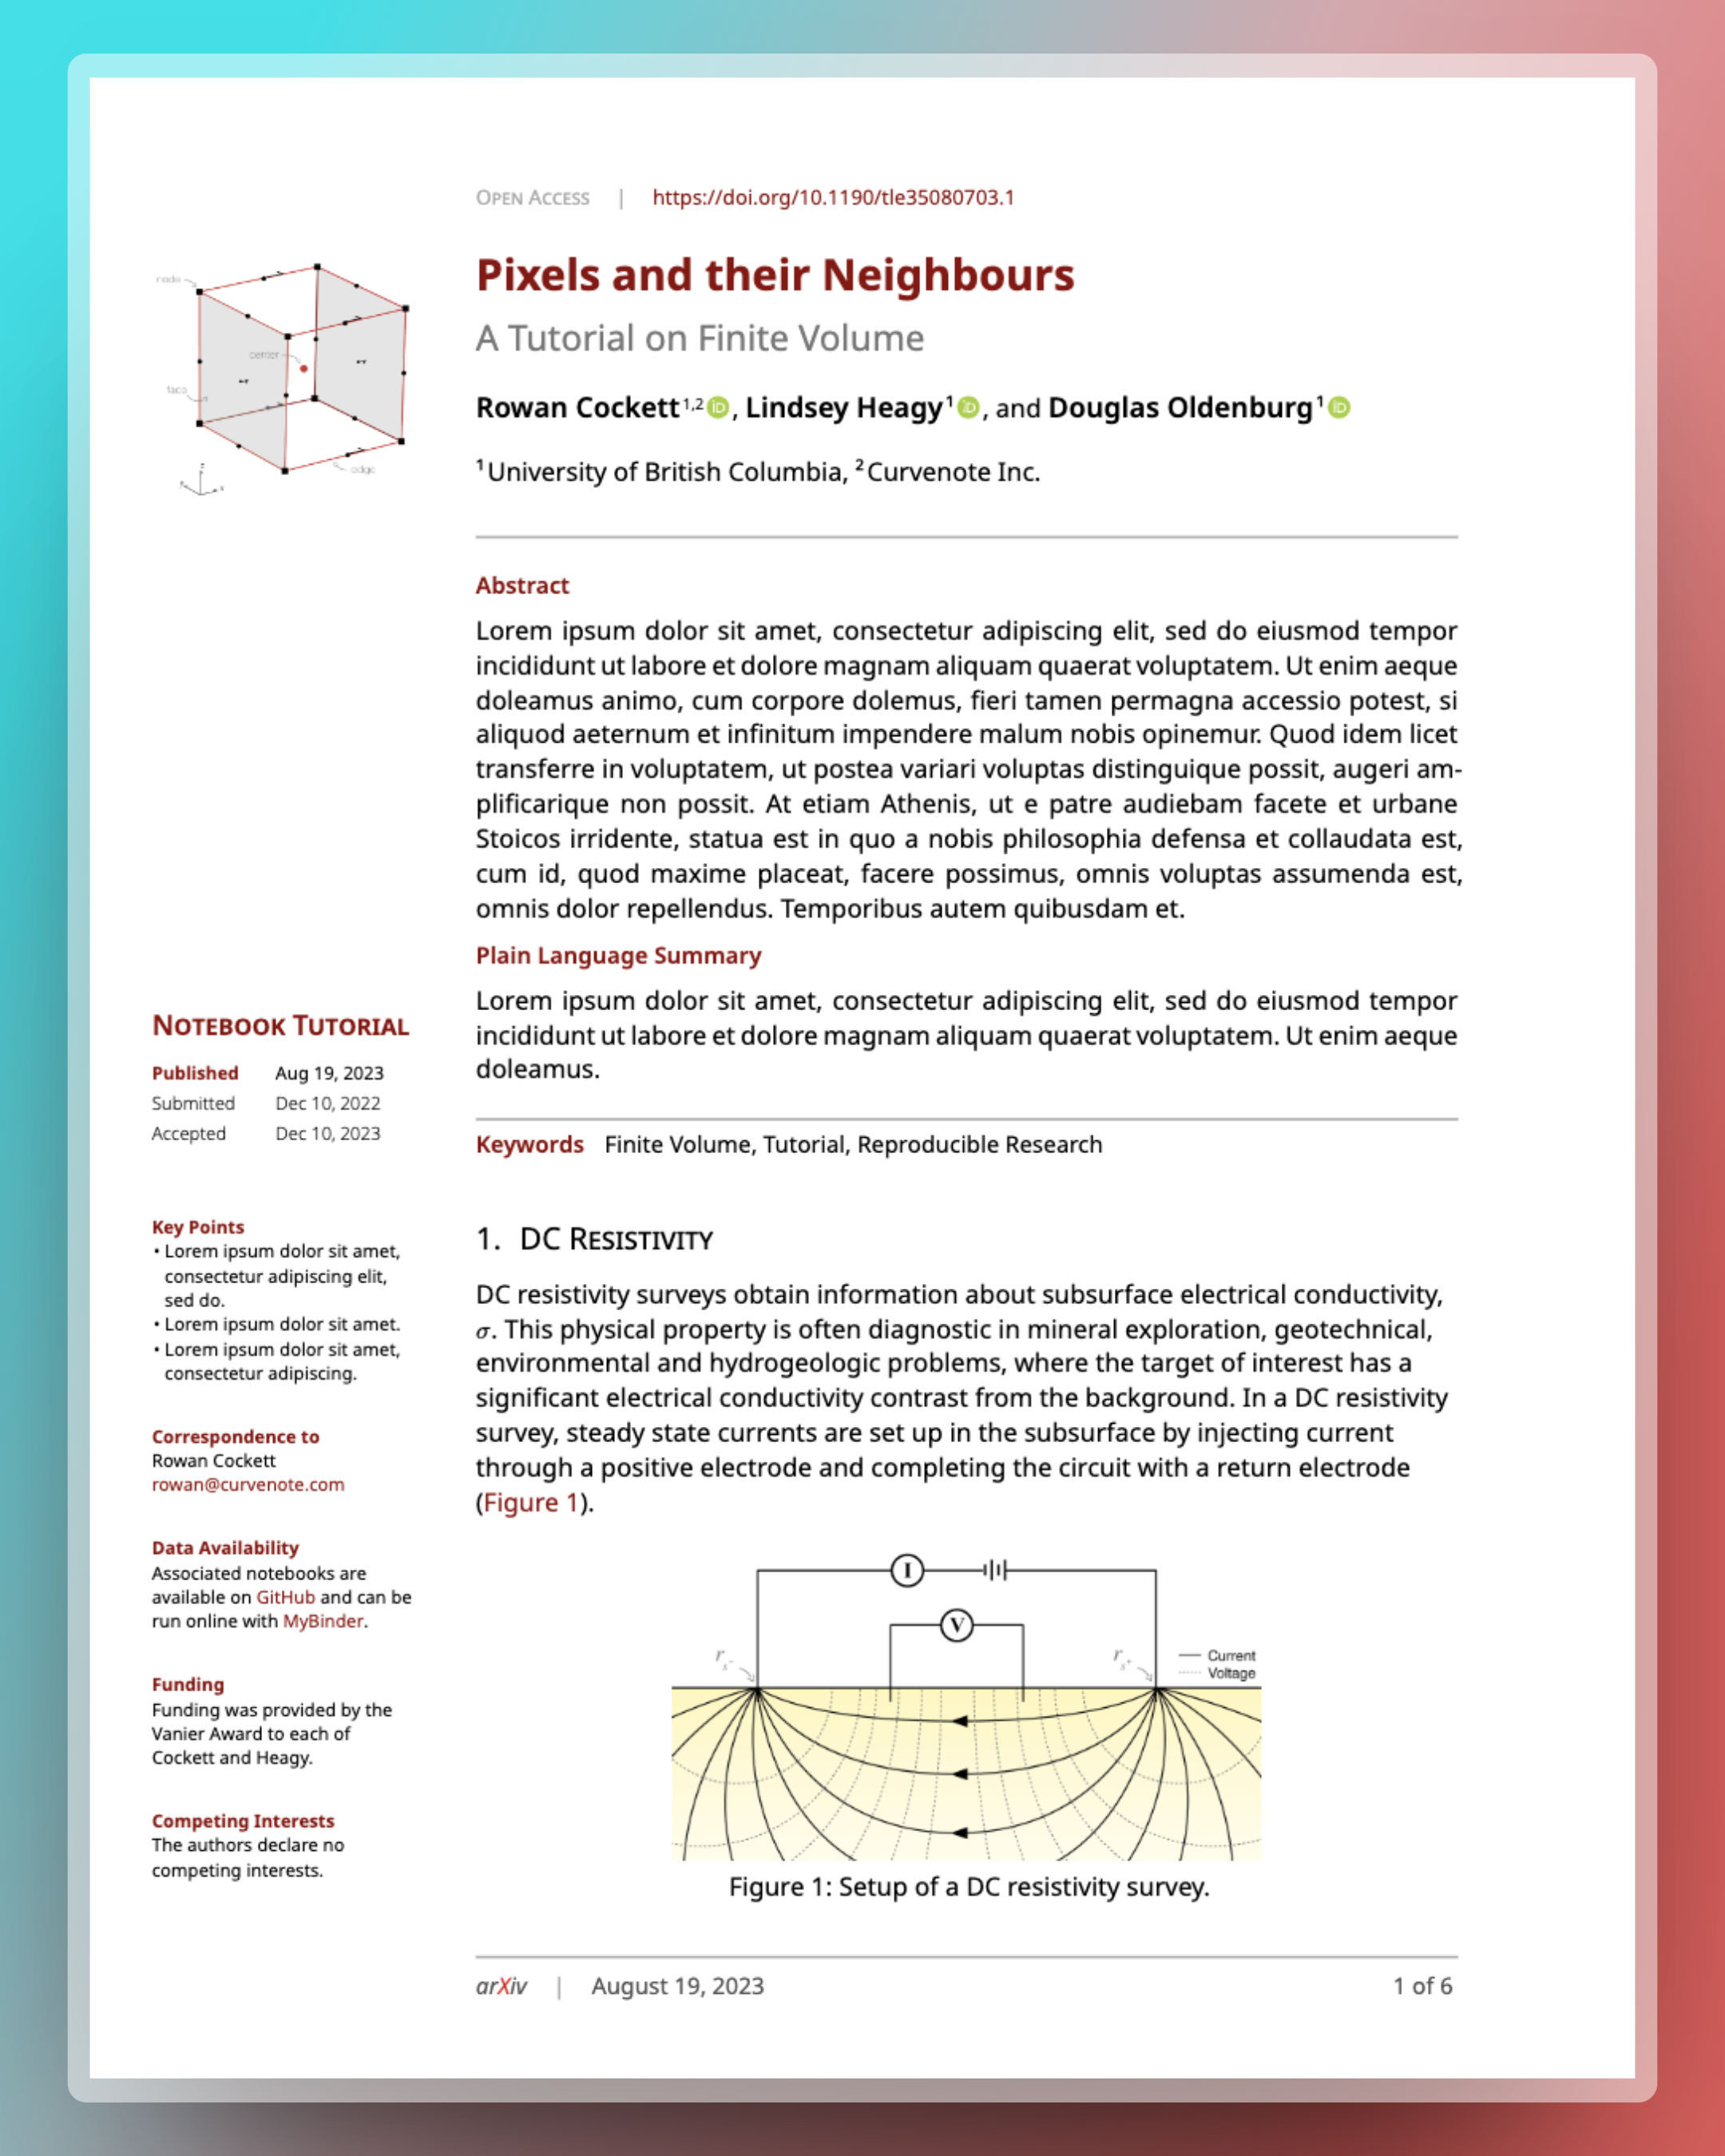
Scientific Typesetting 📝
Replace Word’s manual formatting with Quarto
- Integrates code, references, and figures
- Produces submission-ready documents
- One click → Word, PDF, or LaTeX output
- Interactive with AI natively
Reproducible Research 🔁
- Many published papers are hard to reproduce
- Learn Git & GitHub for version control
- Track changes, back up, and collaborate
- Your future self will thank you!